LGBTQ+ Equality Project
Financial Outlook
Financial Outlook
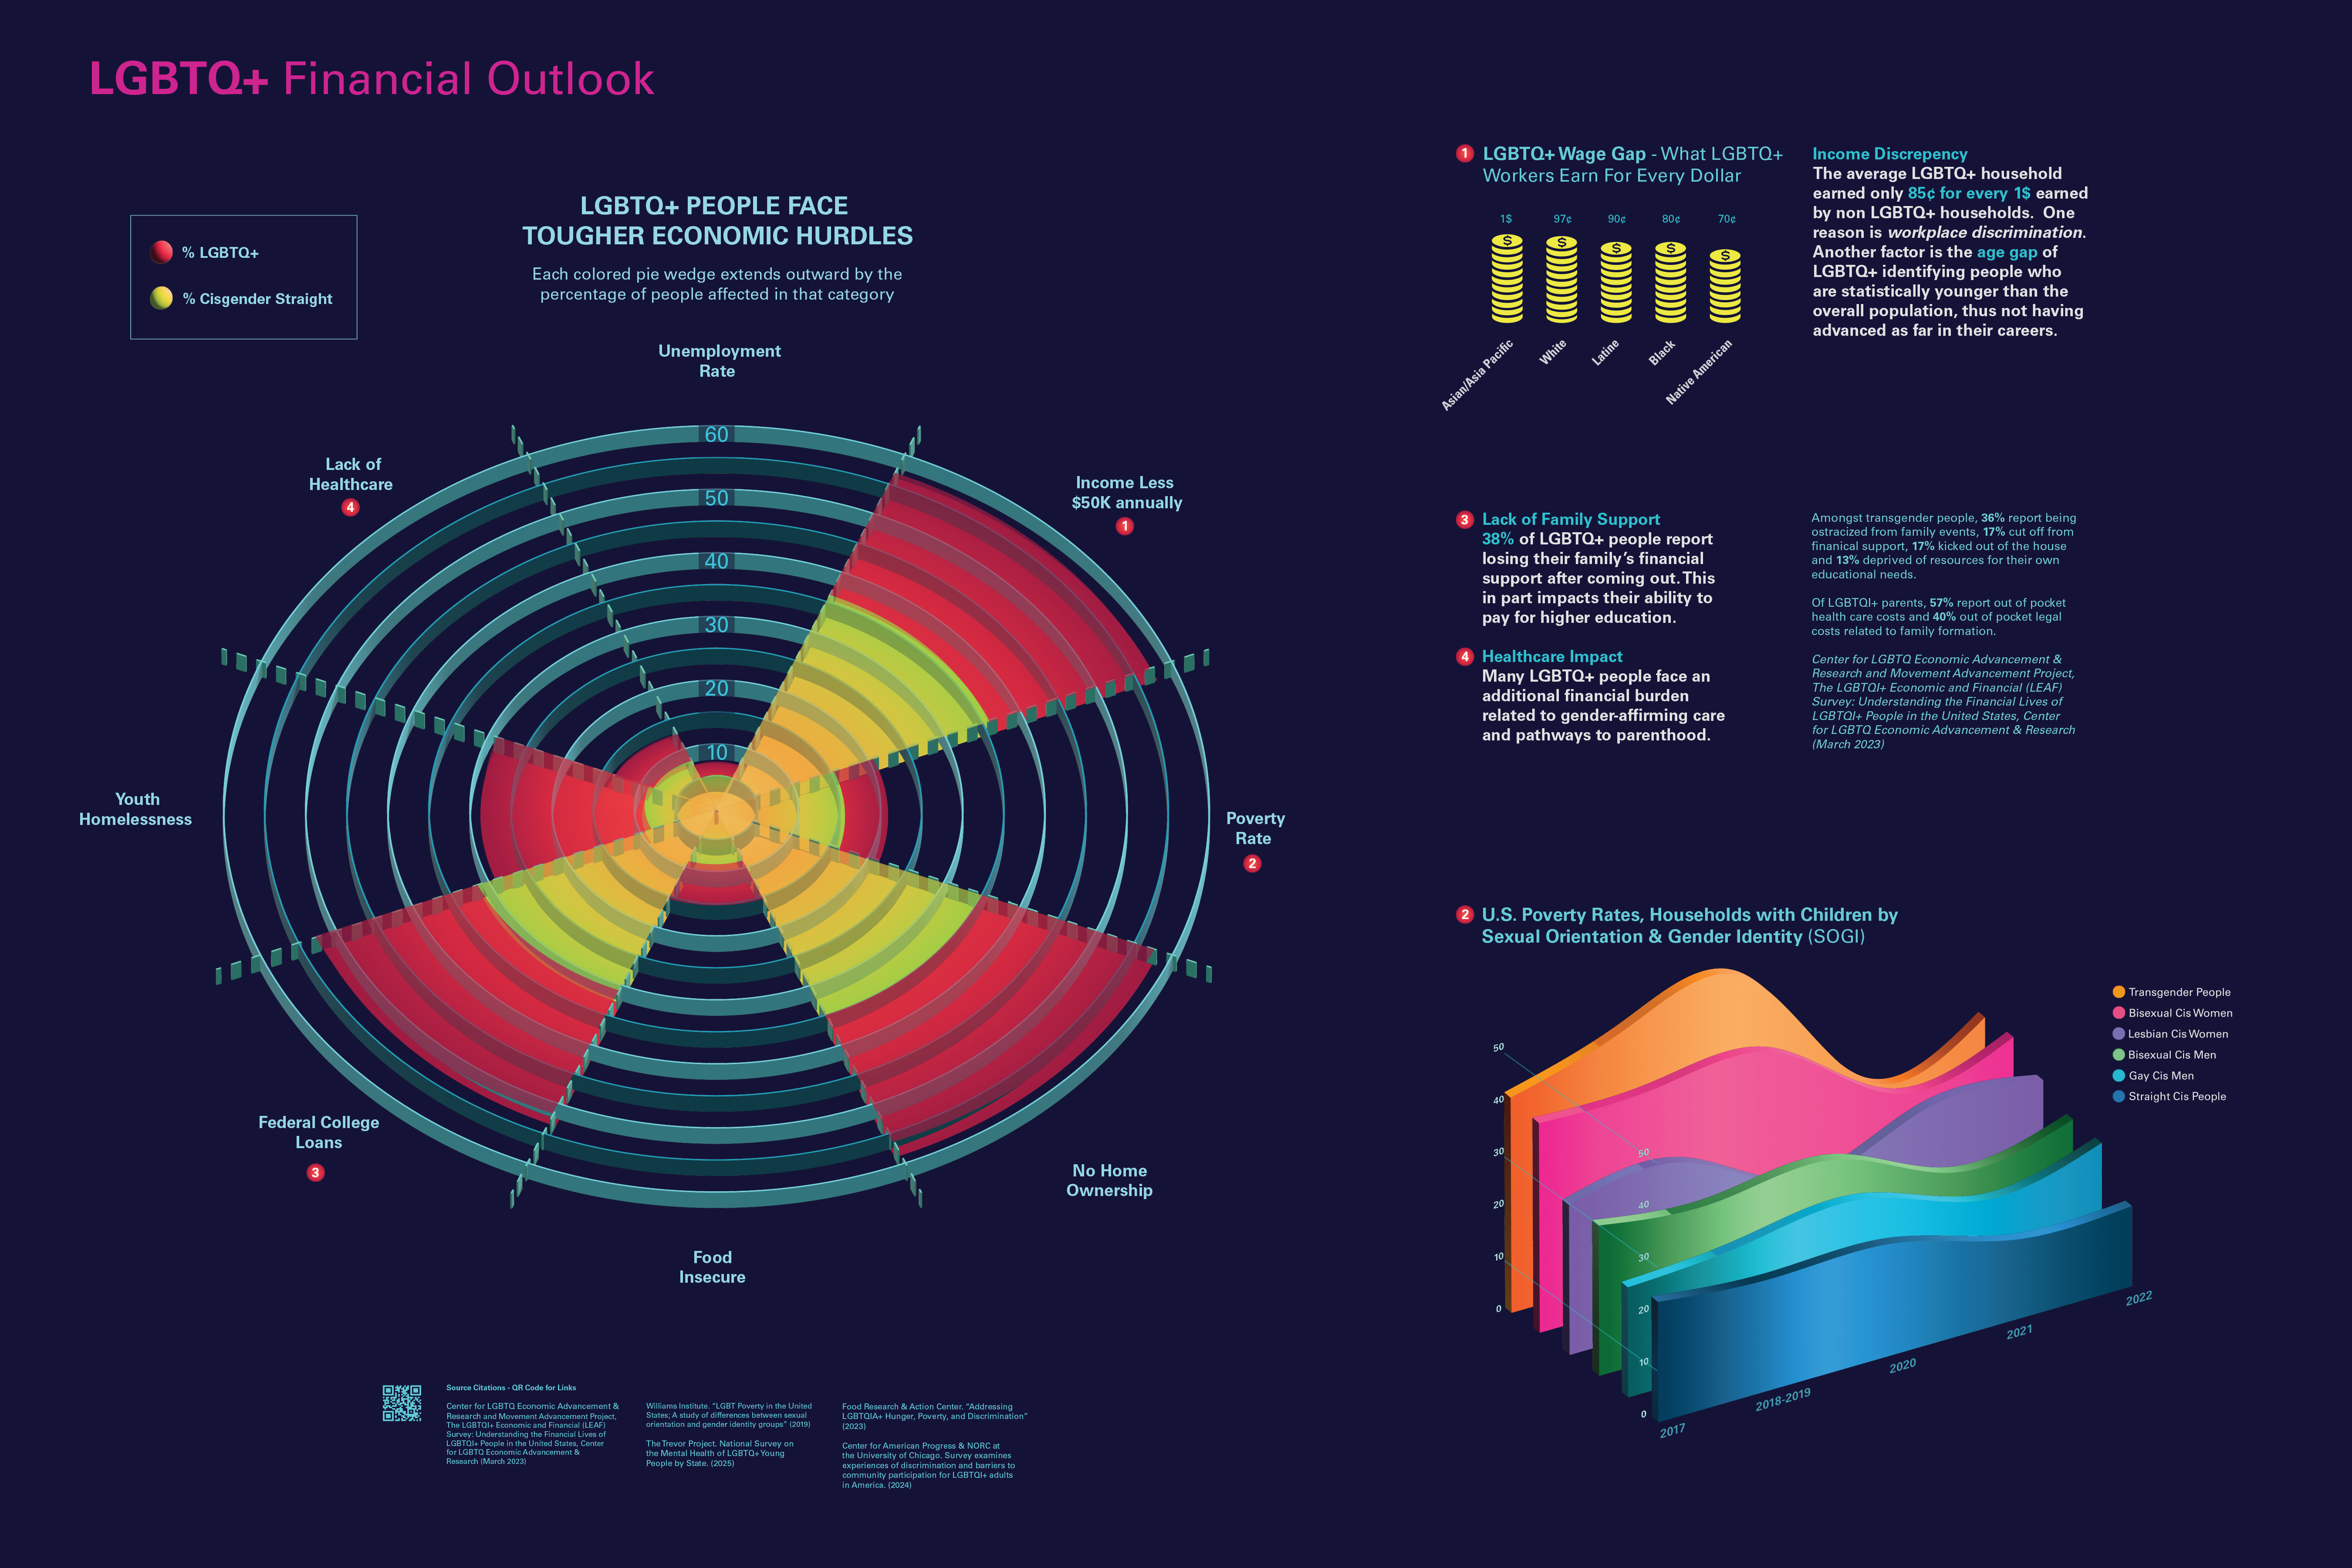
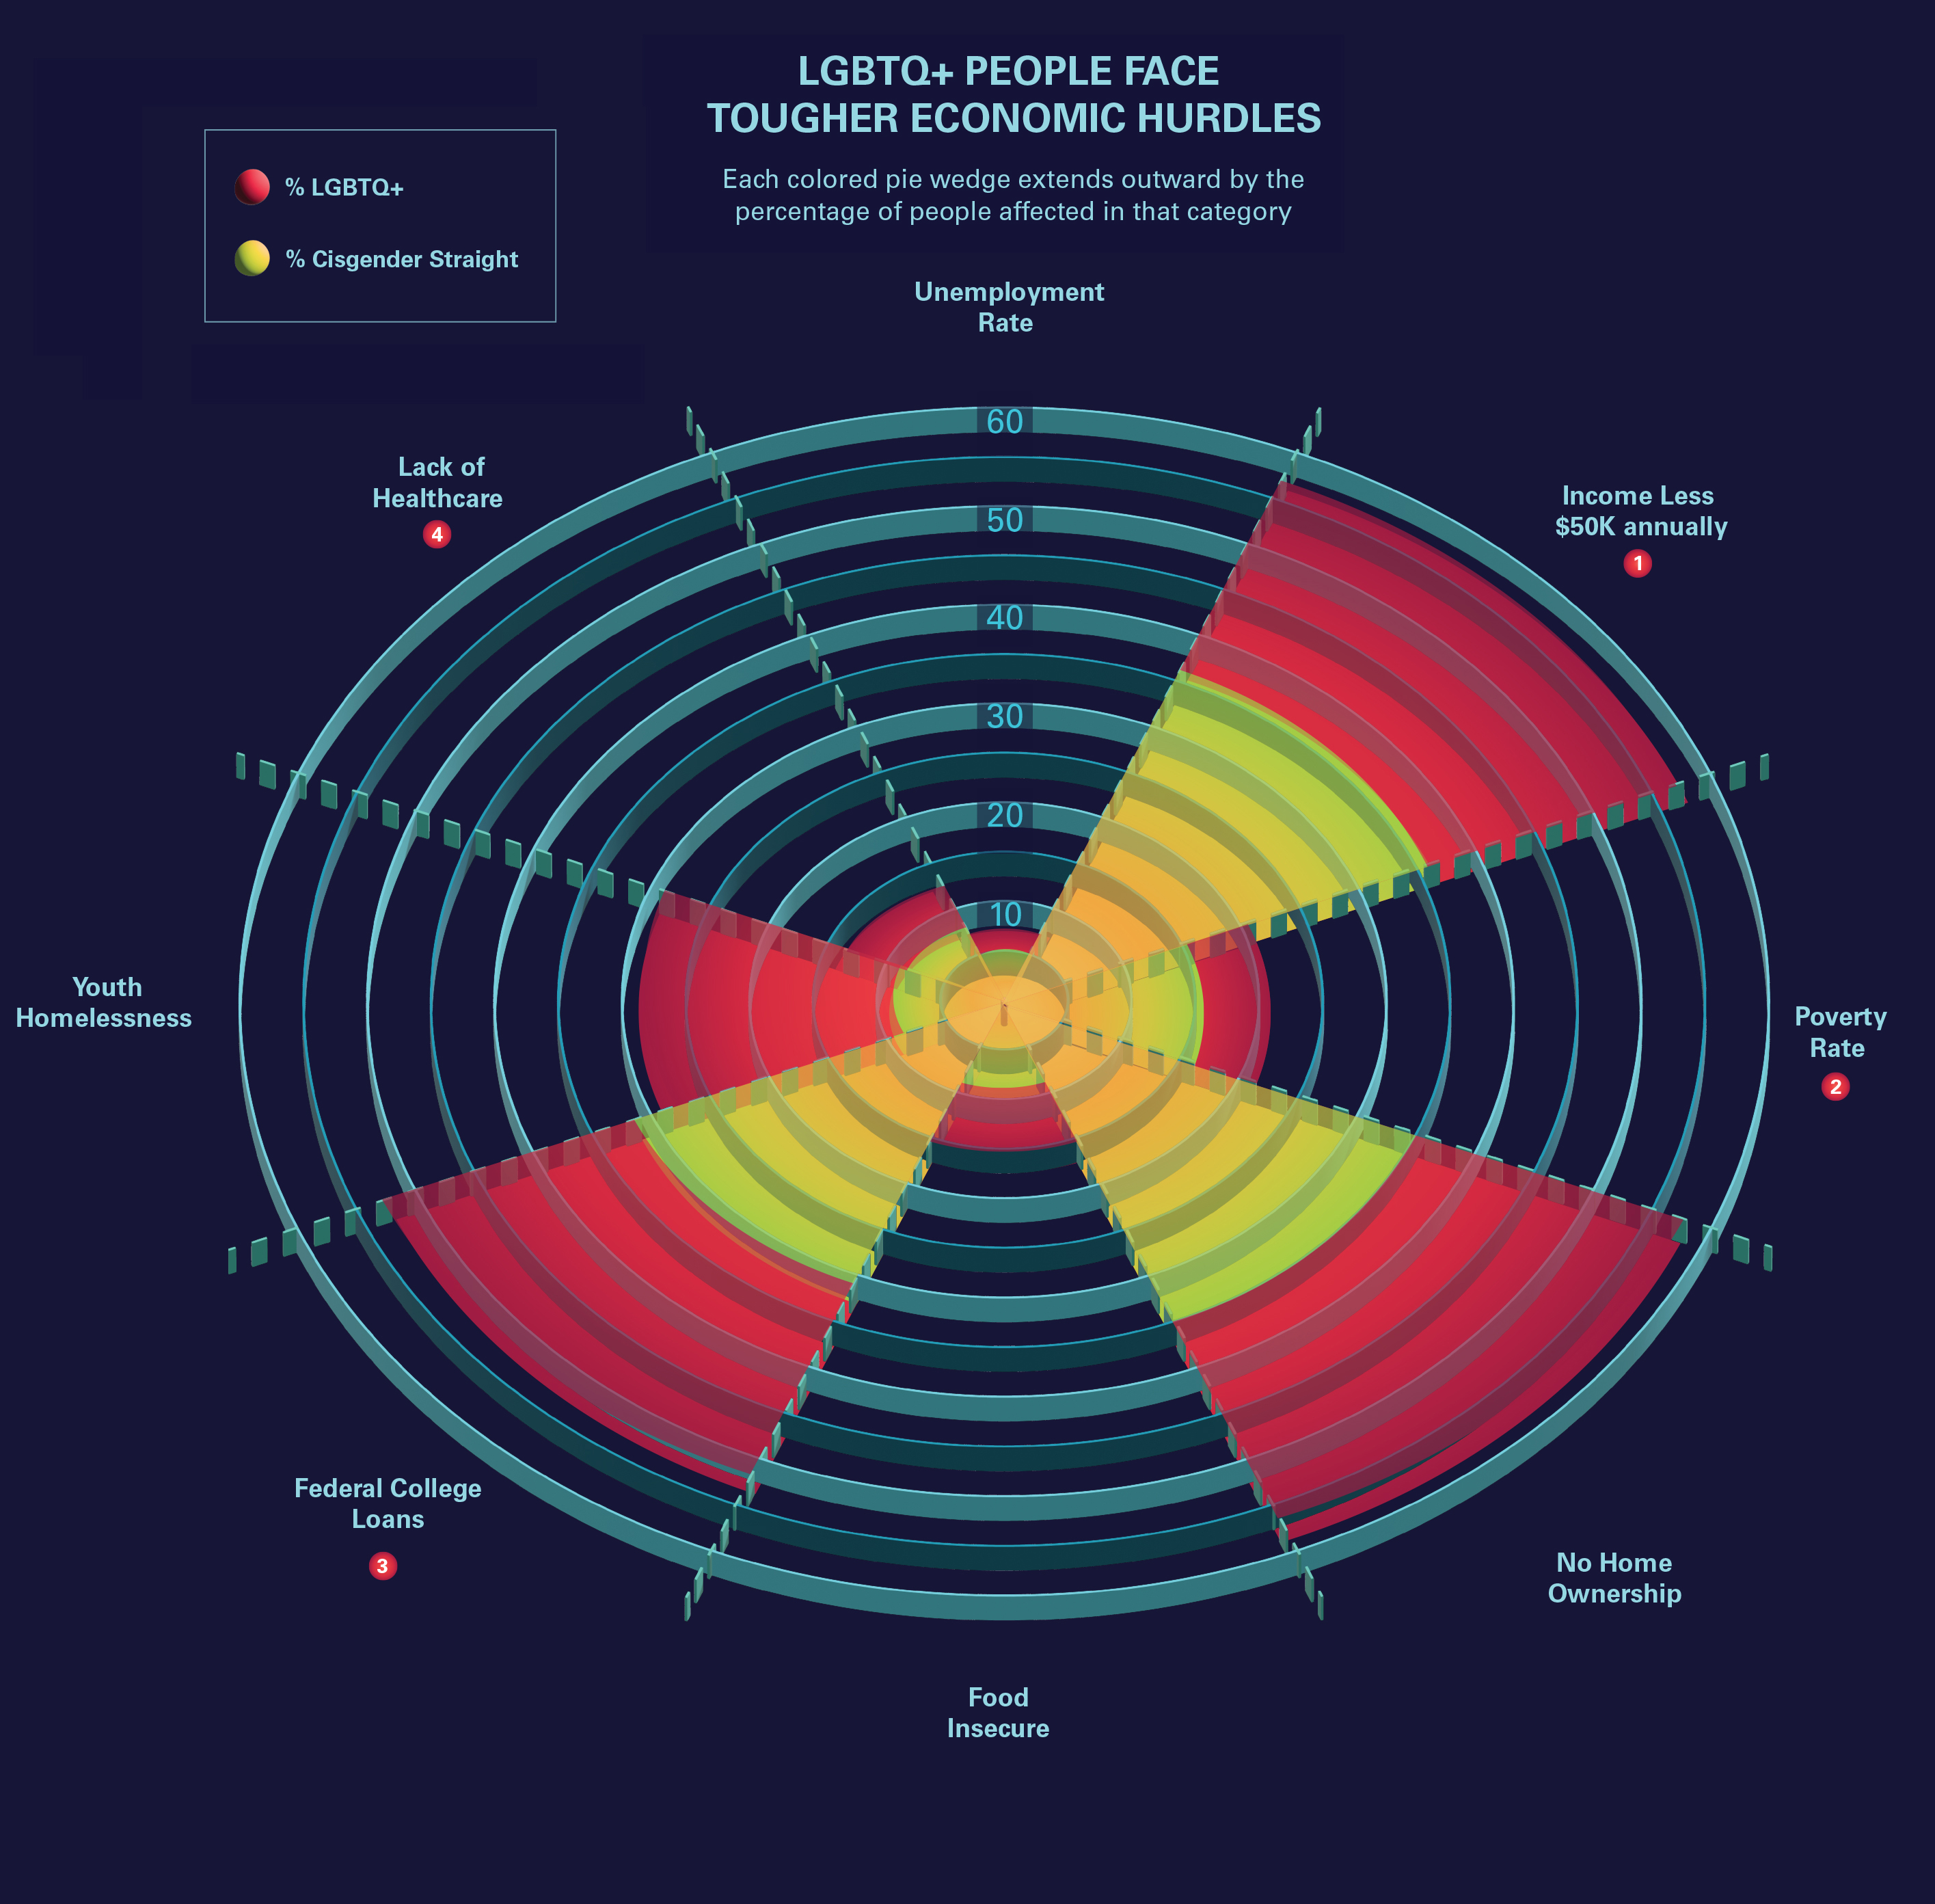
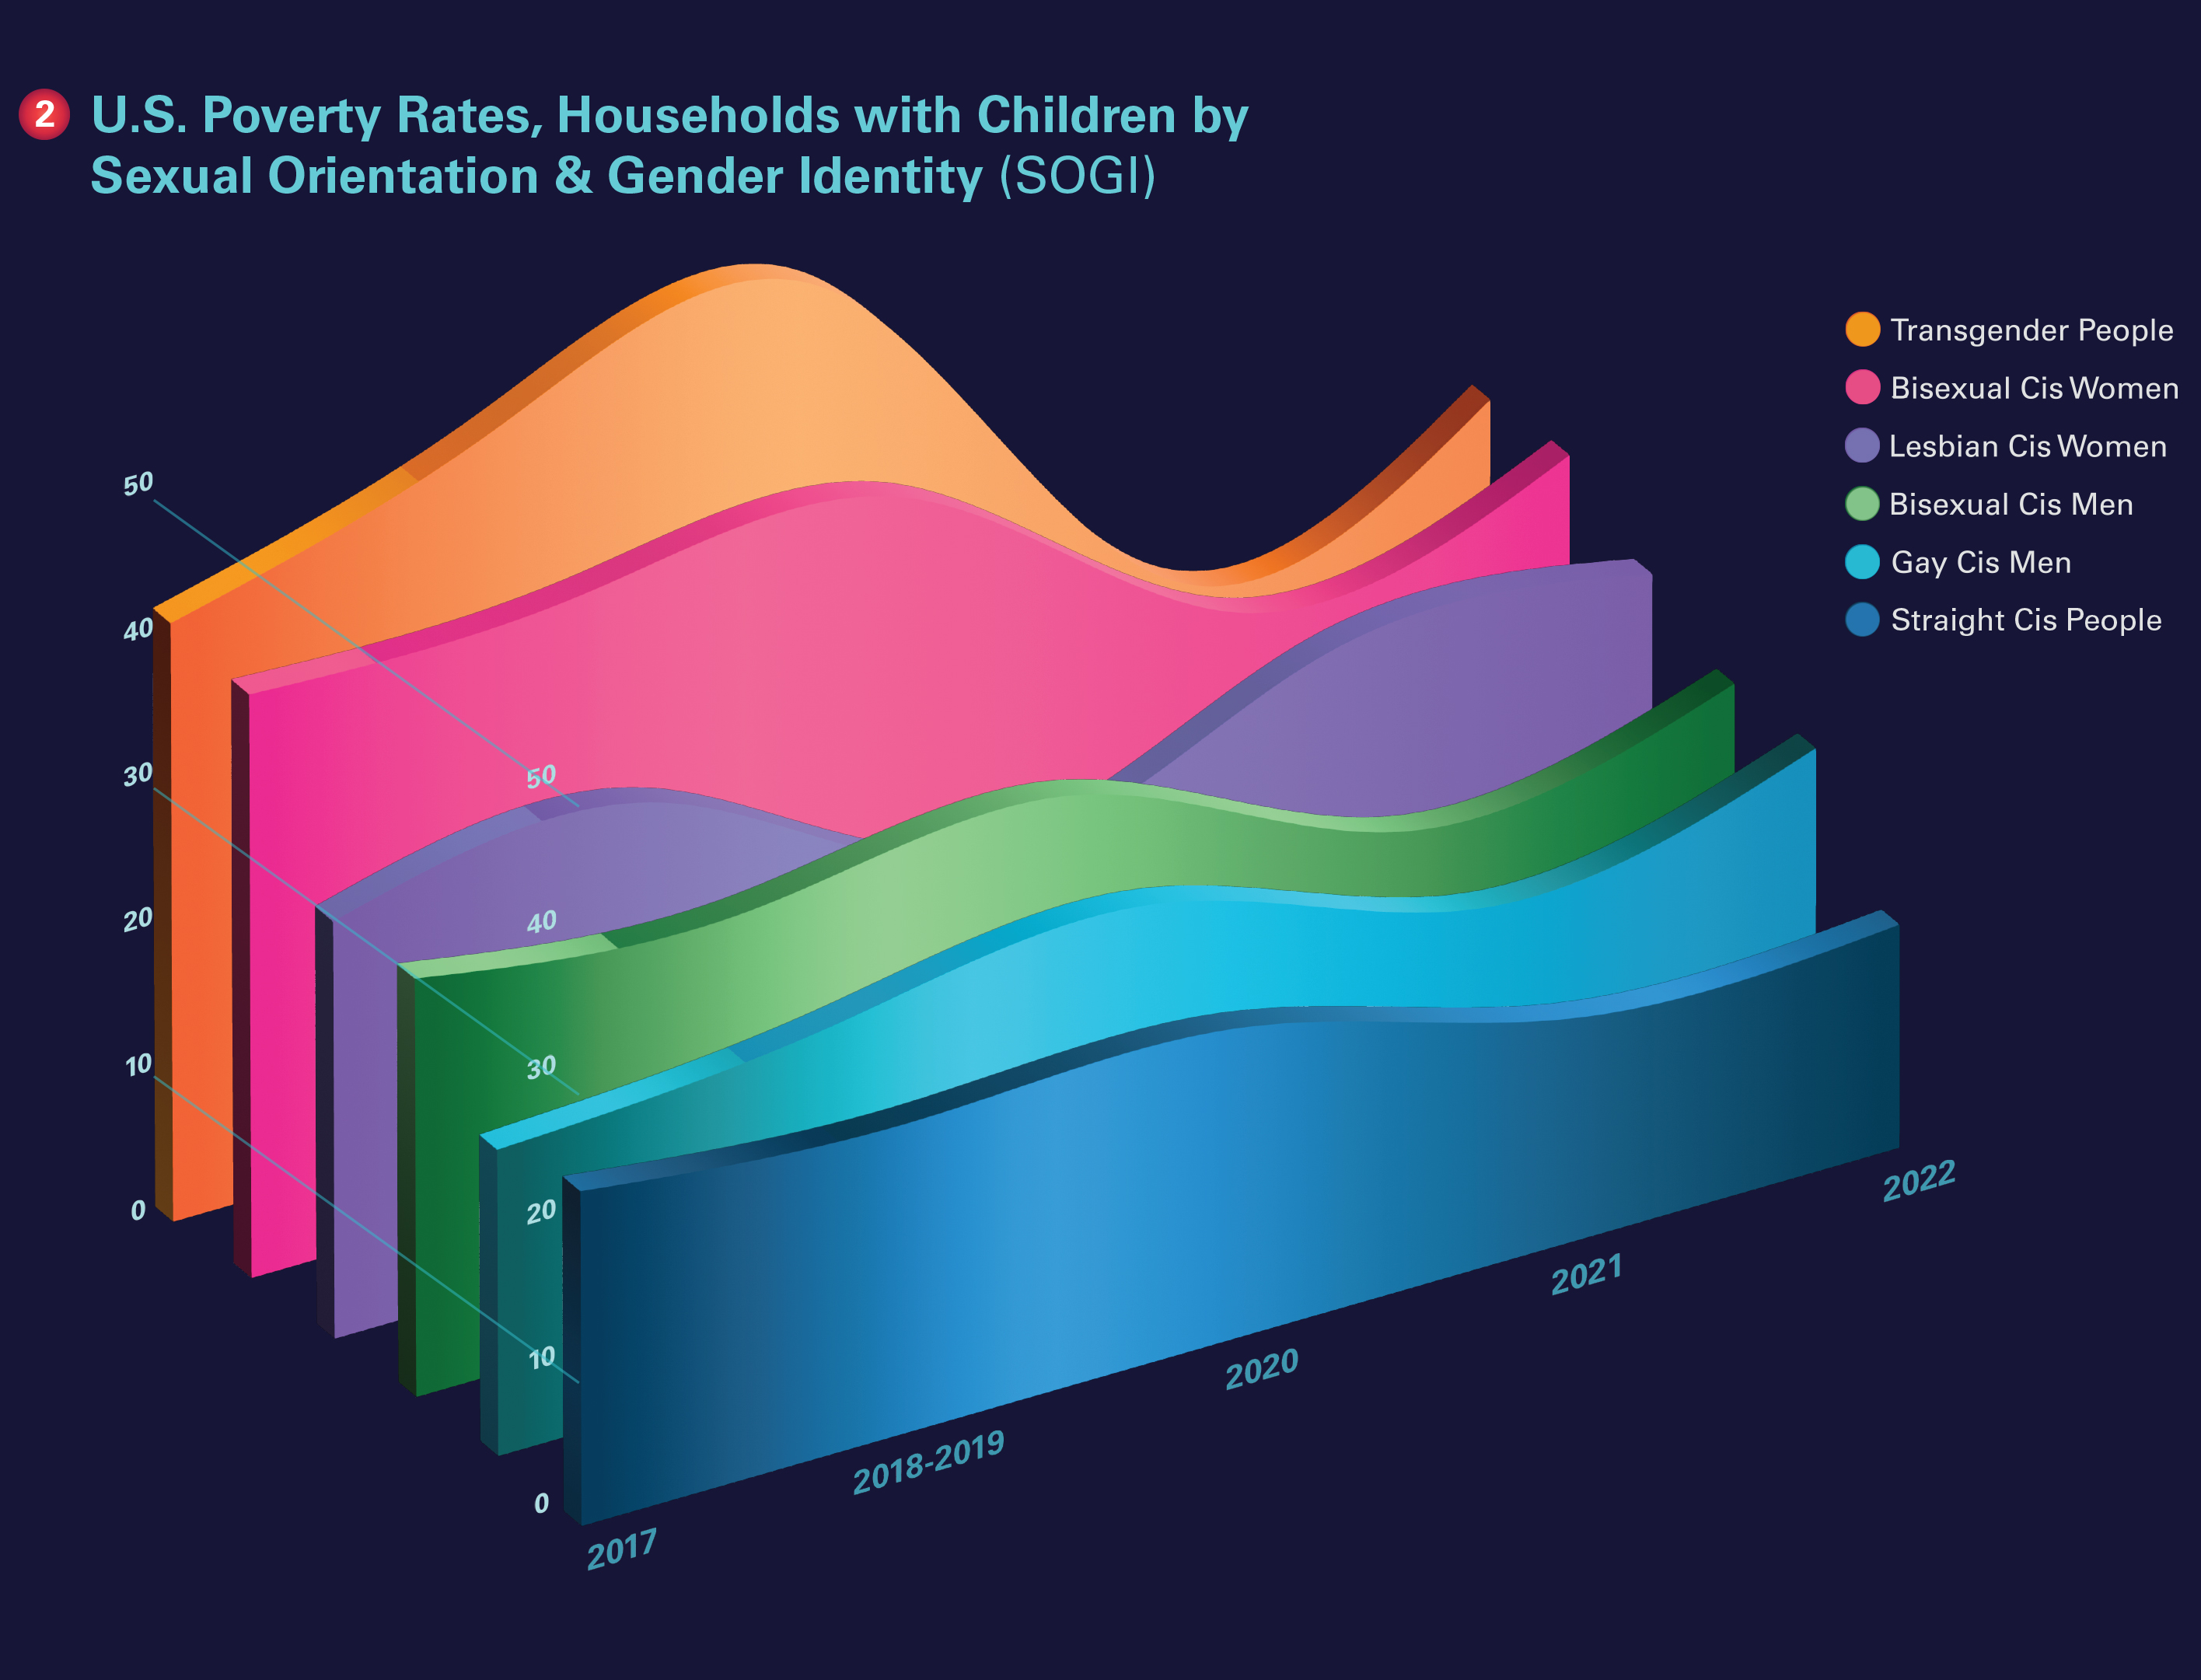
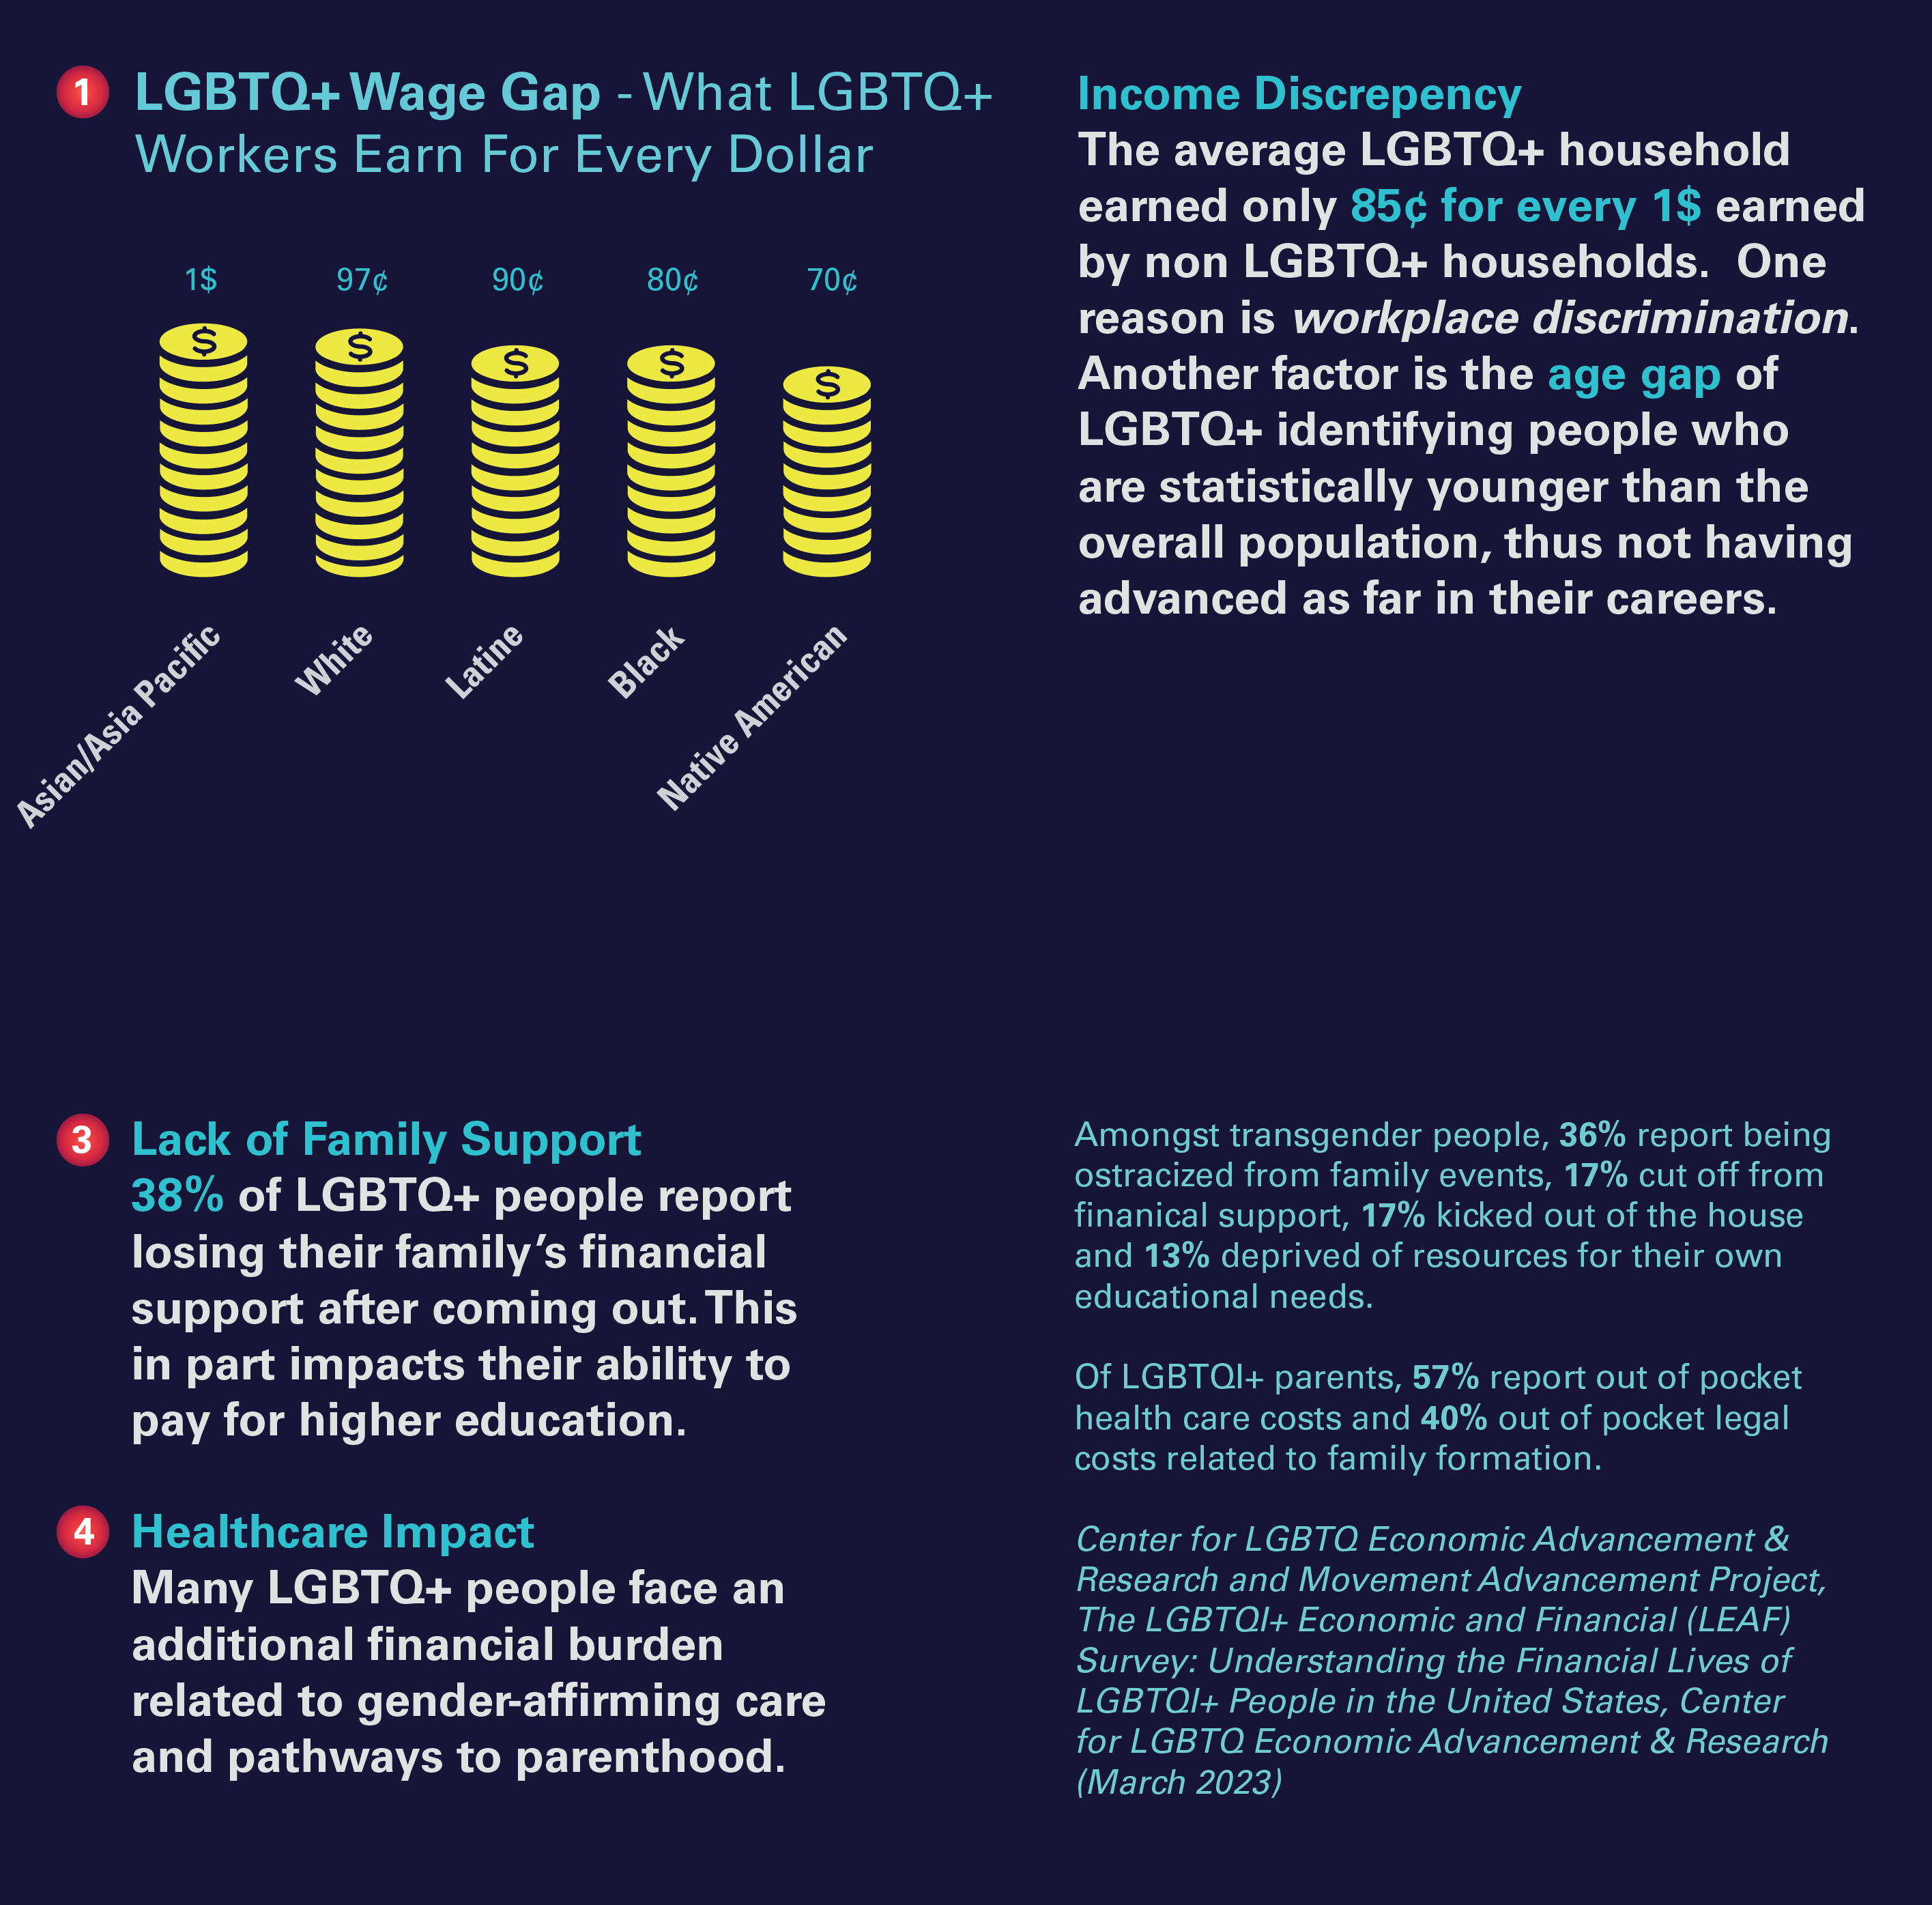
This information design examines how economic hardship is unevenly distributed across LGBTQ+ communities and how structural inequality shapes financial stability over time. At the center, a uniquely designed three dimenstional radial chart compares LGBTQ+ adults with cisgender straight adults across key economic indicators, including poverty, unemployment, food insecurity, lack of healthcare, housing instability, student debt, and youth homelessness. This reveals consistent and often stark disparities. These indicators were researched and data sourced from multiple organizations - see chart below. Surrounding callouts contextualize these gaps through wage inequality, loss of family financial support, and the added costs associated with healthcare and legal barriers.
| Indicator | LGBTQ+ % | CIS Straight % | Source |
|---|---|---|---|
| Healthcare Coverage | 14 | 7 | American Progress |
| Unemployment Rate | 9 | 5 | Williams Institute |
| Youth Homelessness | 28 | 7.3 | Trevor Project |
| Poverty Rate | 21.6 | 15.7 | Williams Institute |
| Federal College Loans | 53 | 31 | Center for LGBTQ Economic Advancement & Research, Movement Advancement Project |
| Income less than $50,000 per year | 57 | 36 | Center for LGBTQ Economic Advancement & Research, Movement Advancement Project |
| Home ownership | 57 | 35 | Center for LGBTQ Economic Advancement & Research, Movement Advancement Project |
| Food Insecure | 57 | 35 | Food Research & Action Center |
Size: 36"x24" printed
© 2026 danielle currier