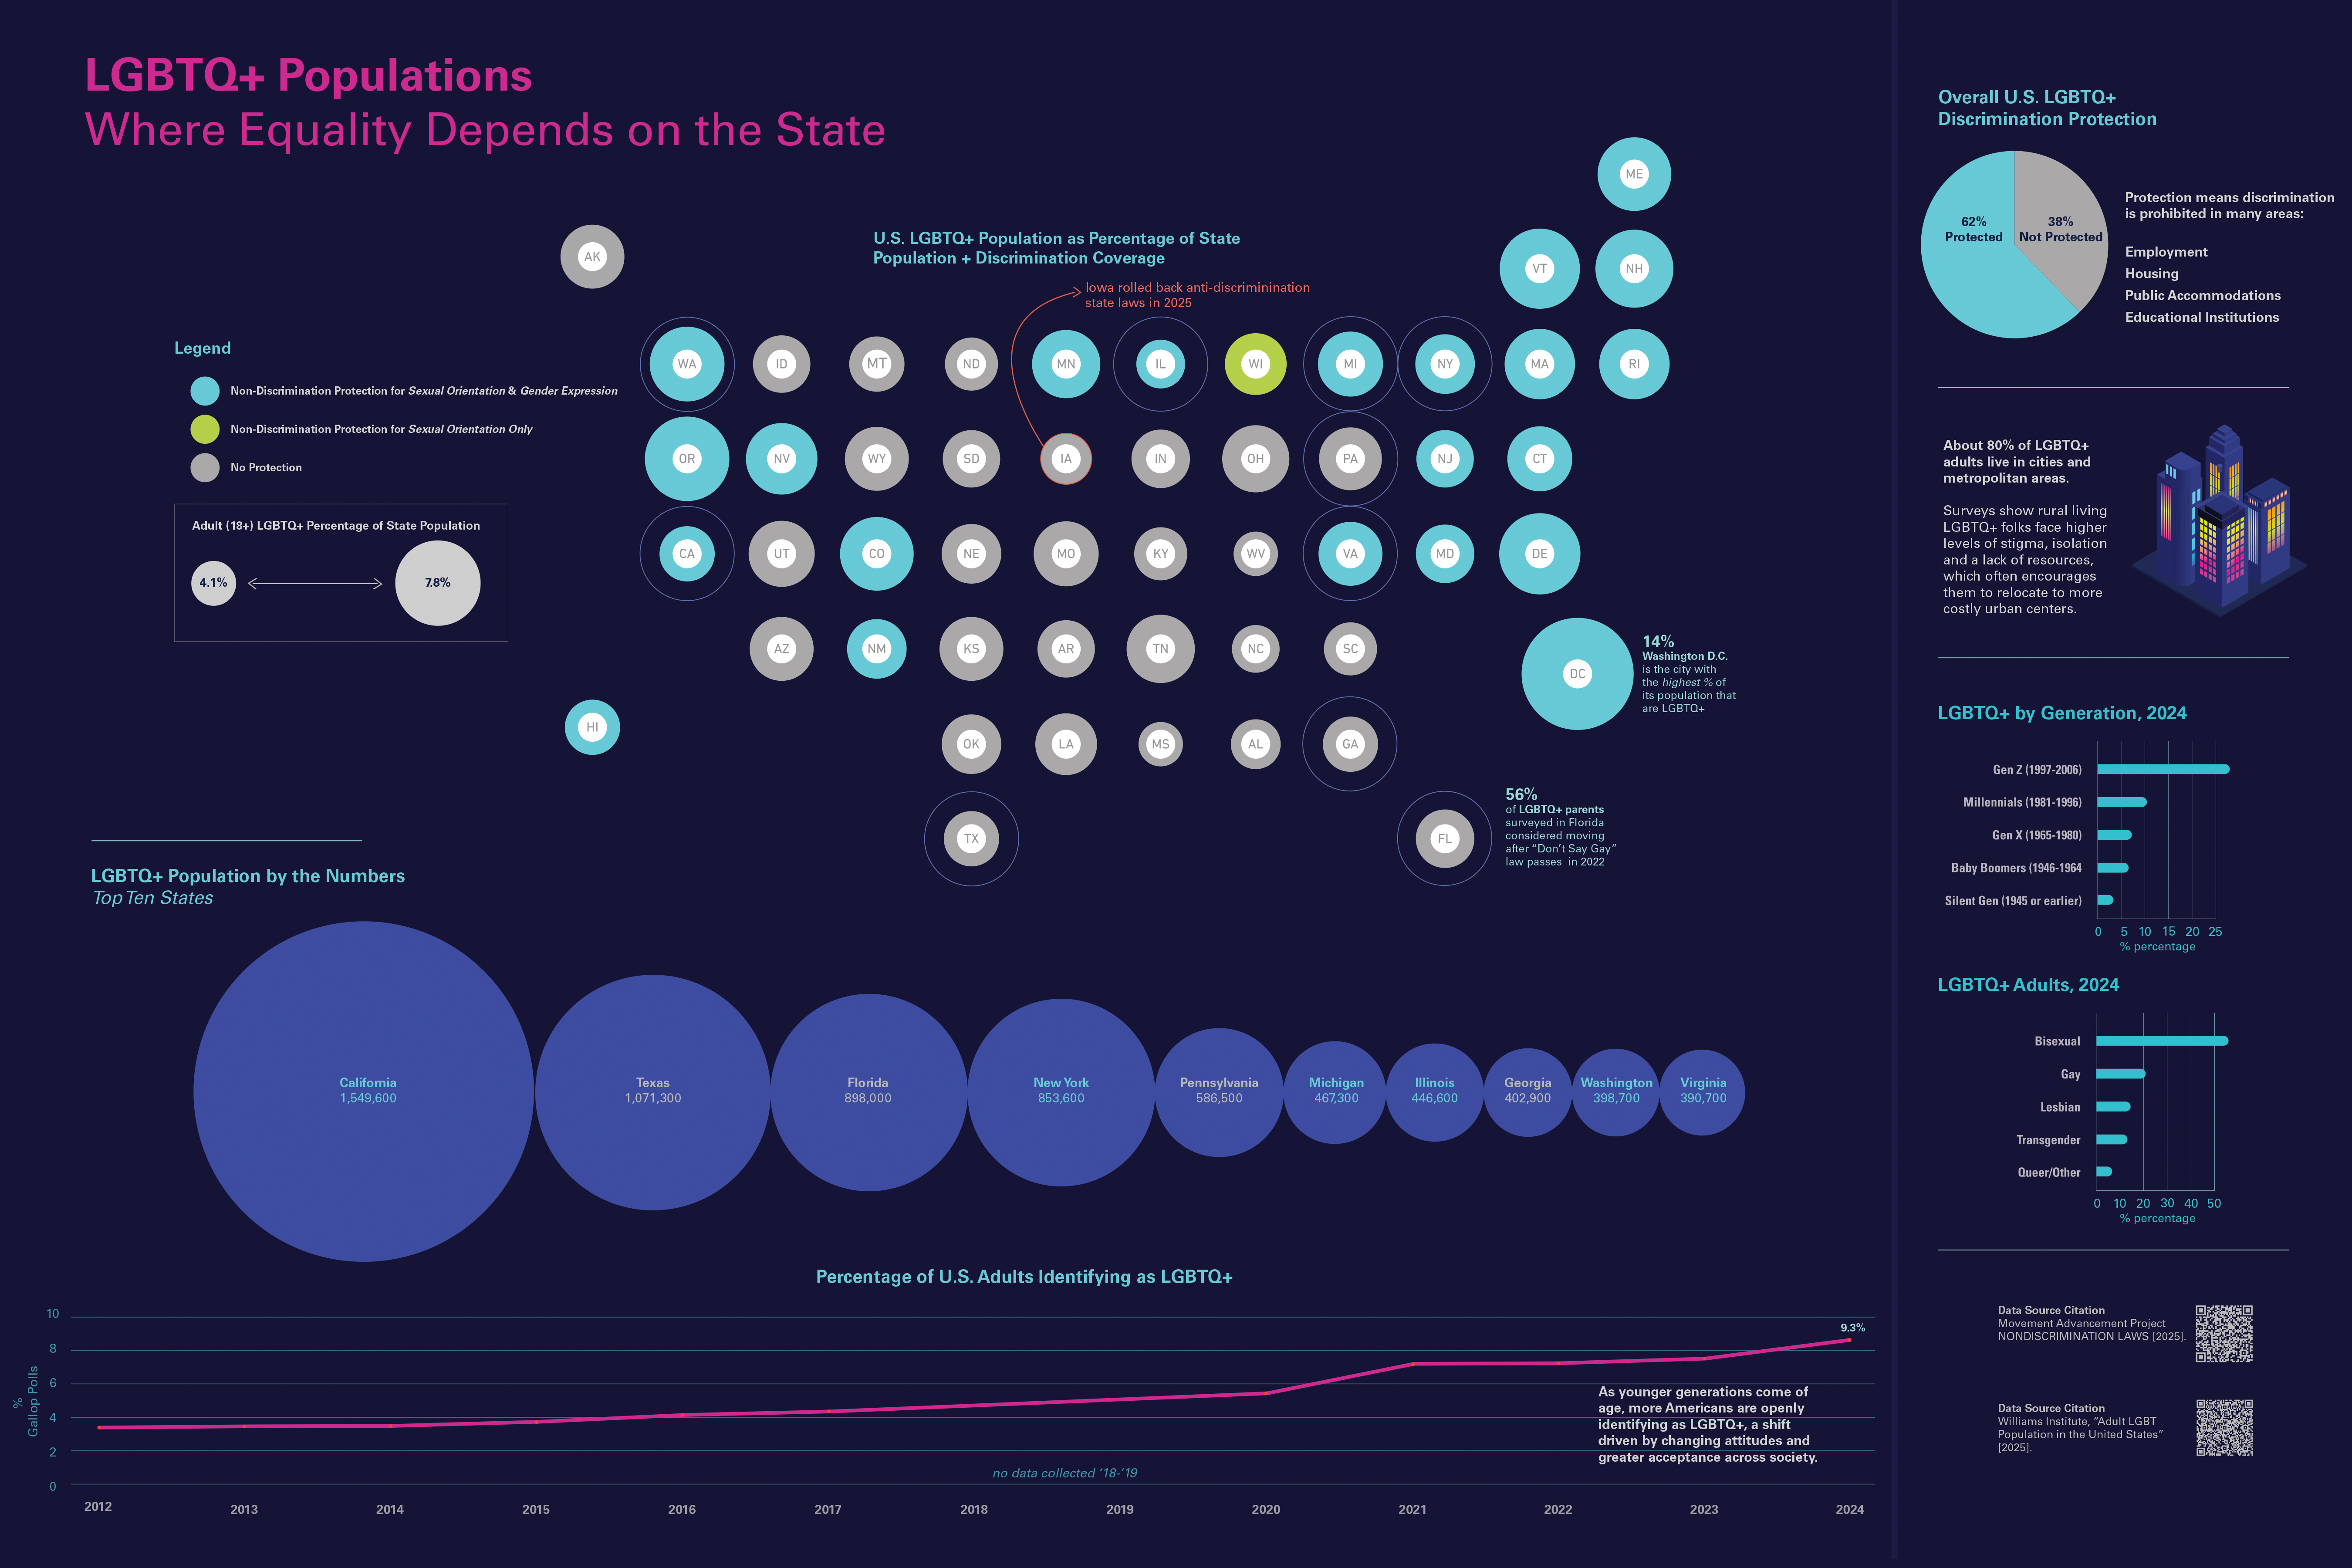
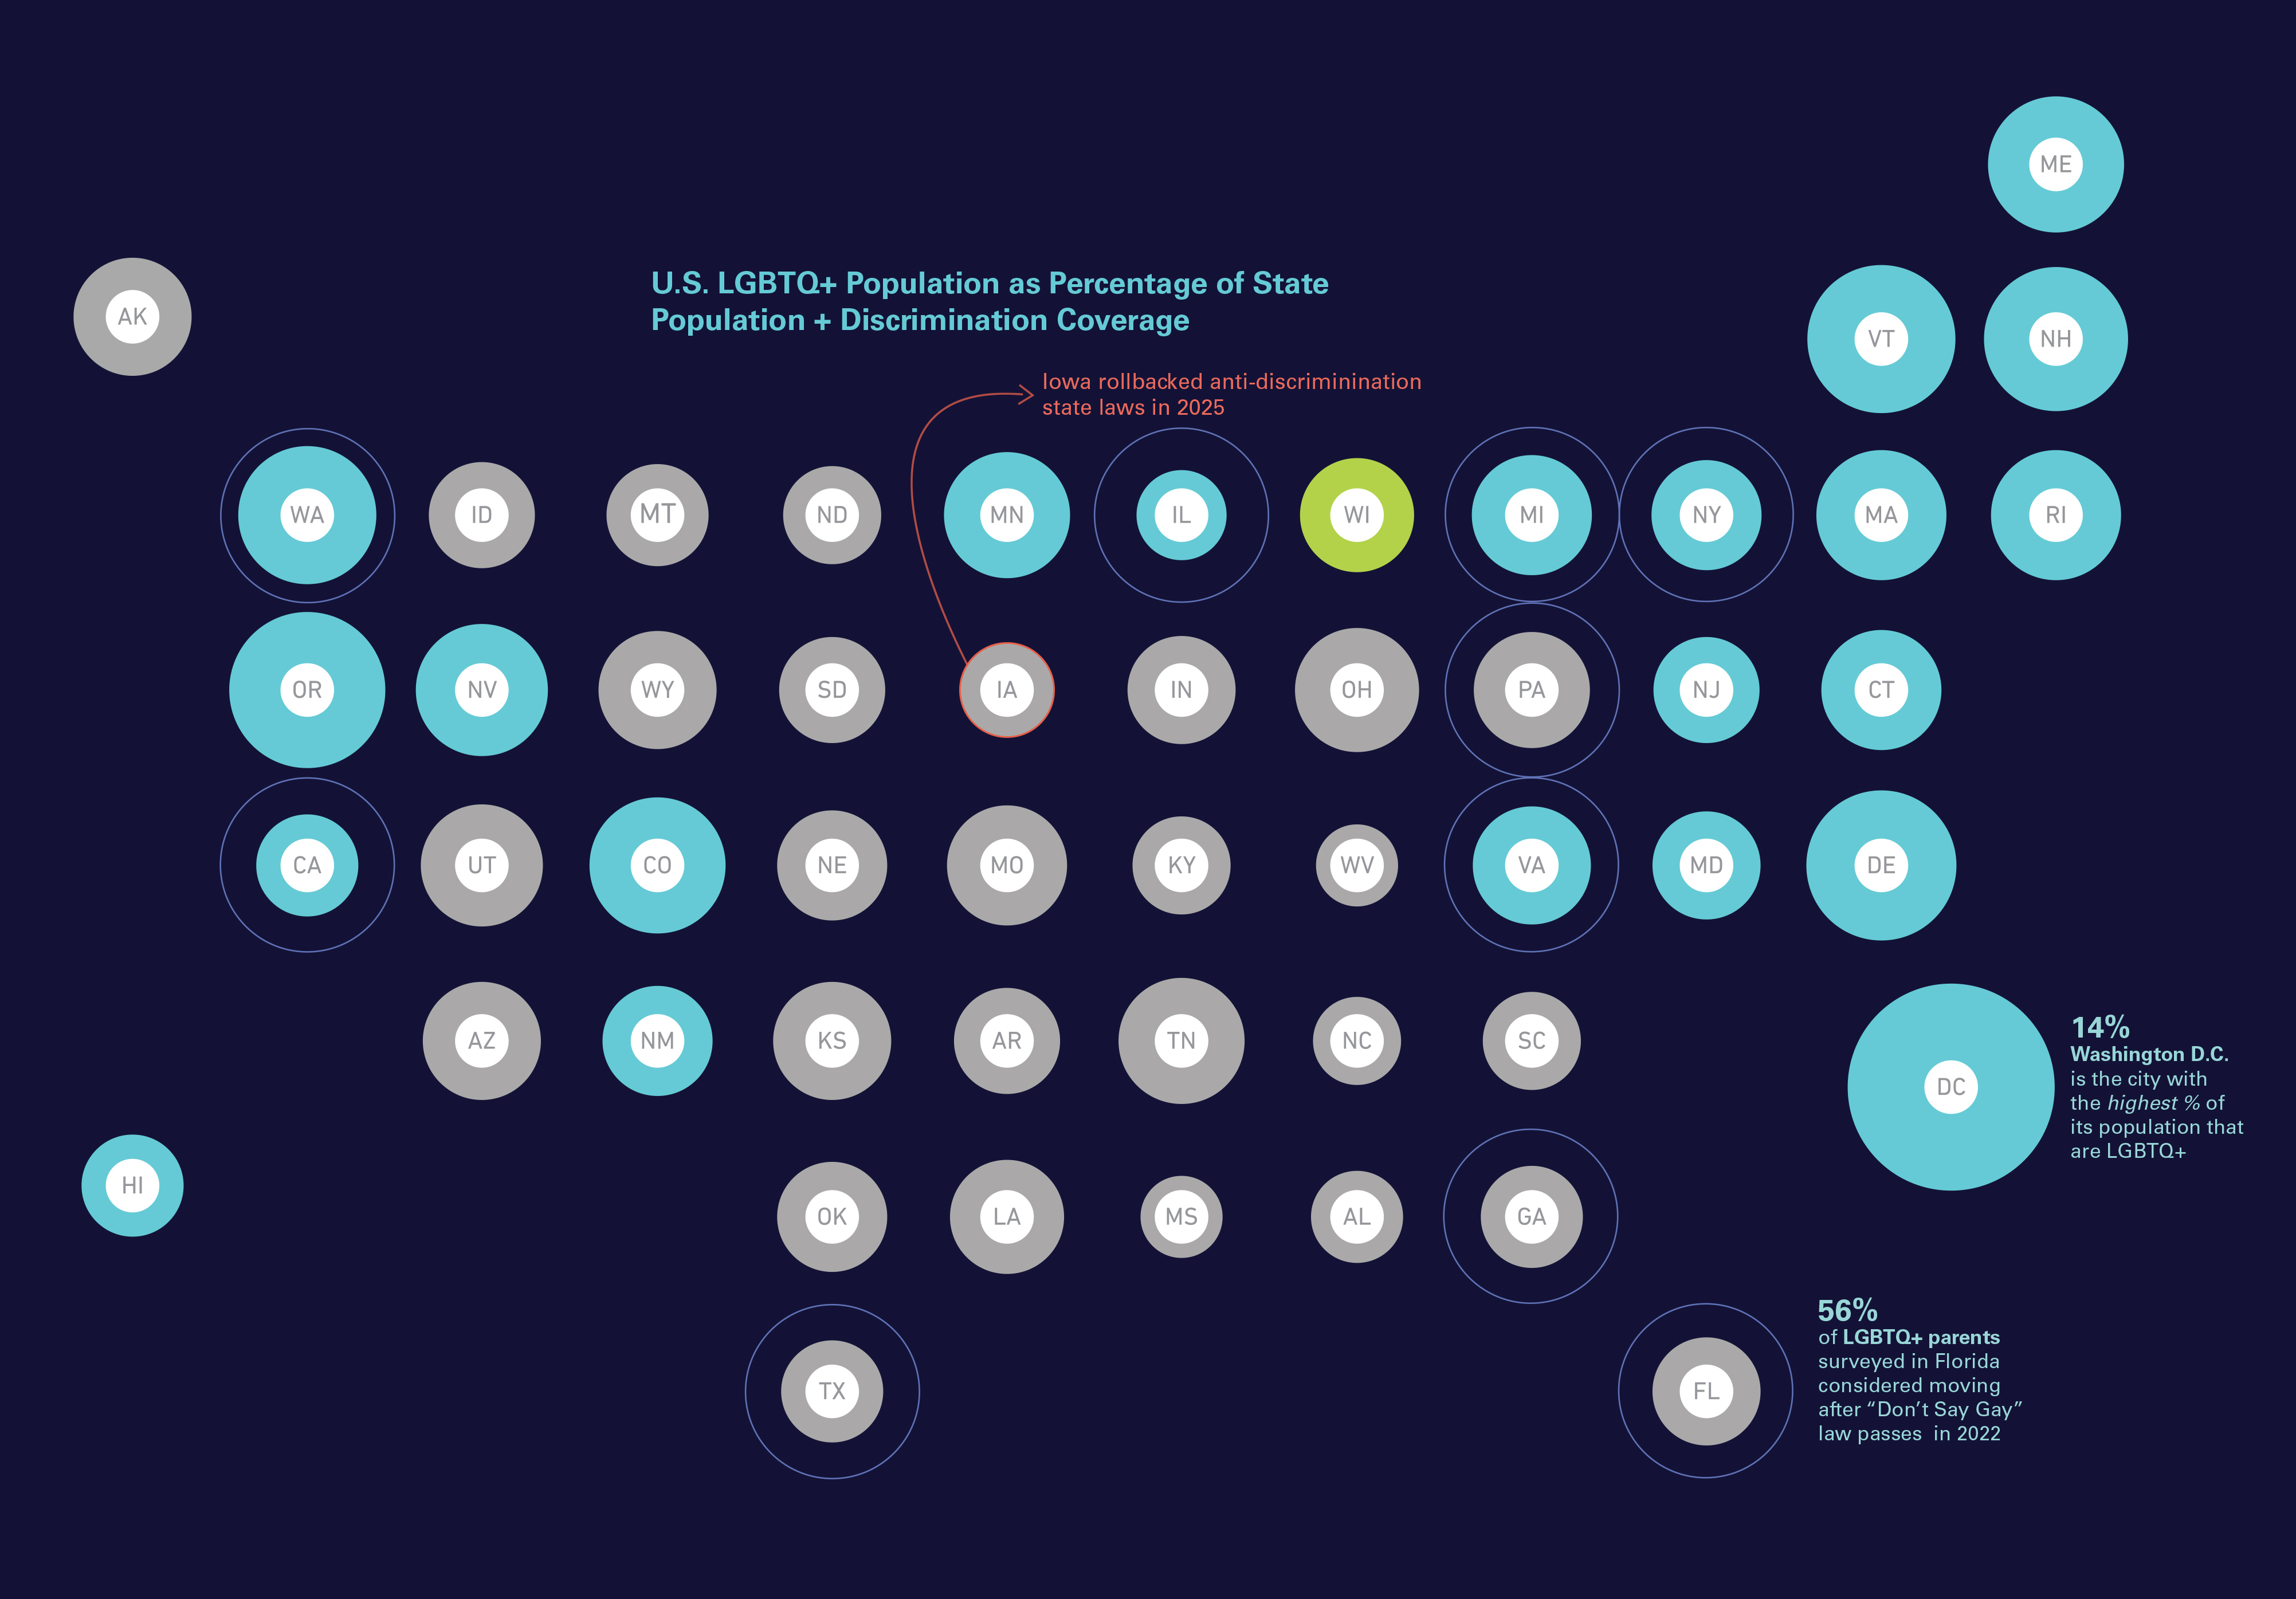
This information design visualizes the distribution of LGBTQ+ populations across the United States, revealing how equality and lived experience vary significantly by state. Using a bubble-based state map, the design compares the percentage of adults identifying as LGBTQ+ alongside the presence or absence of nondiscrimination protections, making visible where legal safeguards align or conflict with population size. Supporting graphics provide additional context, including the top states by total LGBTQ+ population, generational differences in LGBTQ+ identification, and national trends showing steady growth over time. Together, these layered views highlight a critical tension: LGBTQ+ people are present in every state, yet legal protections and social support remain uneven, reinforcing how geography plays a decisive role in equality, safety, and opportunity across the country.
Data sources:
Williams Intitute -
ADULT LGBT POPULATION
in the United States (2023)The Movement Advancement Project -
Nondiscrimination Laws