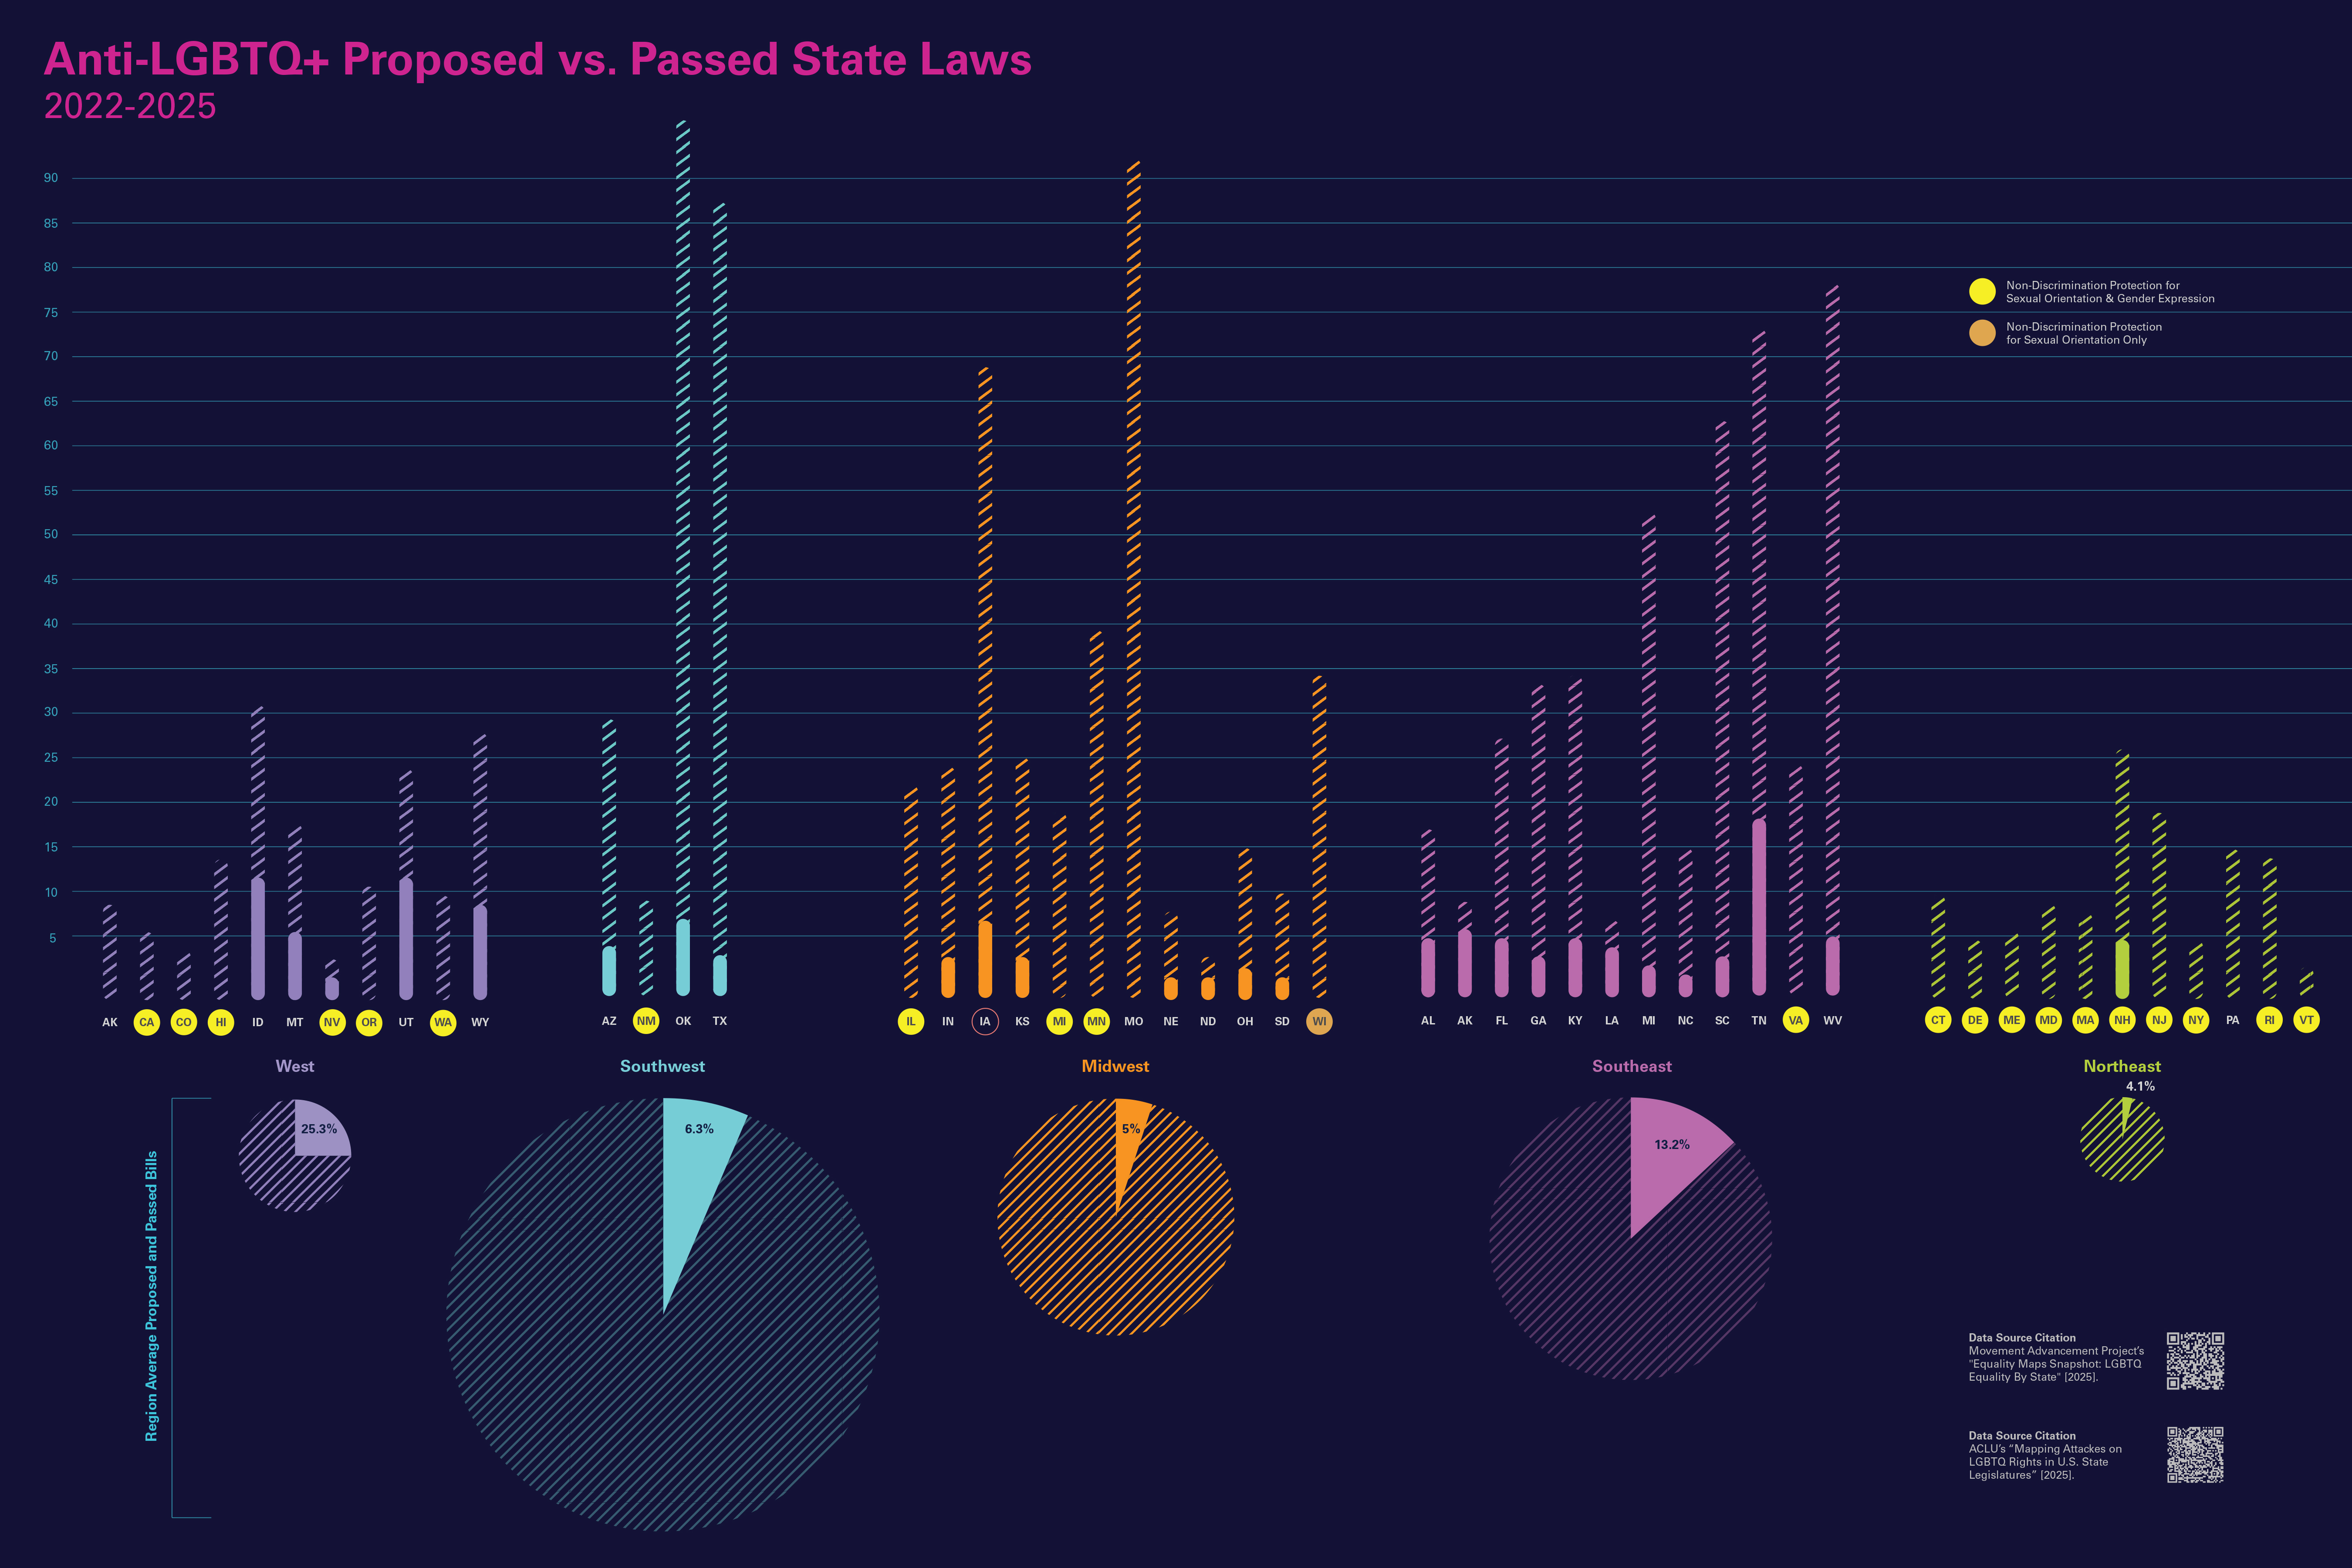
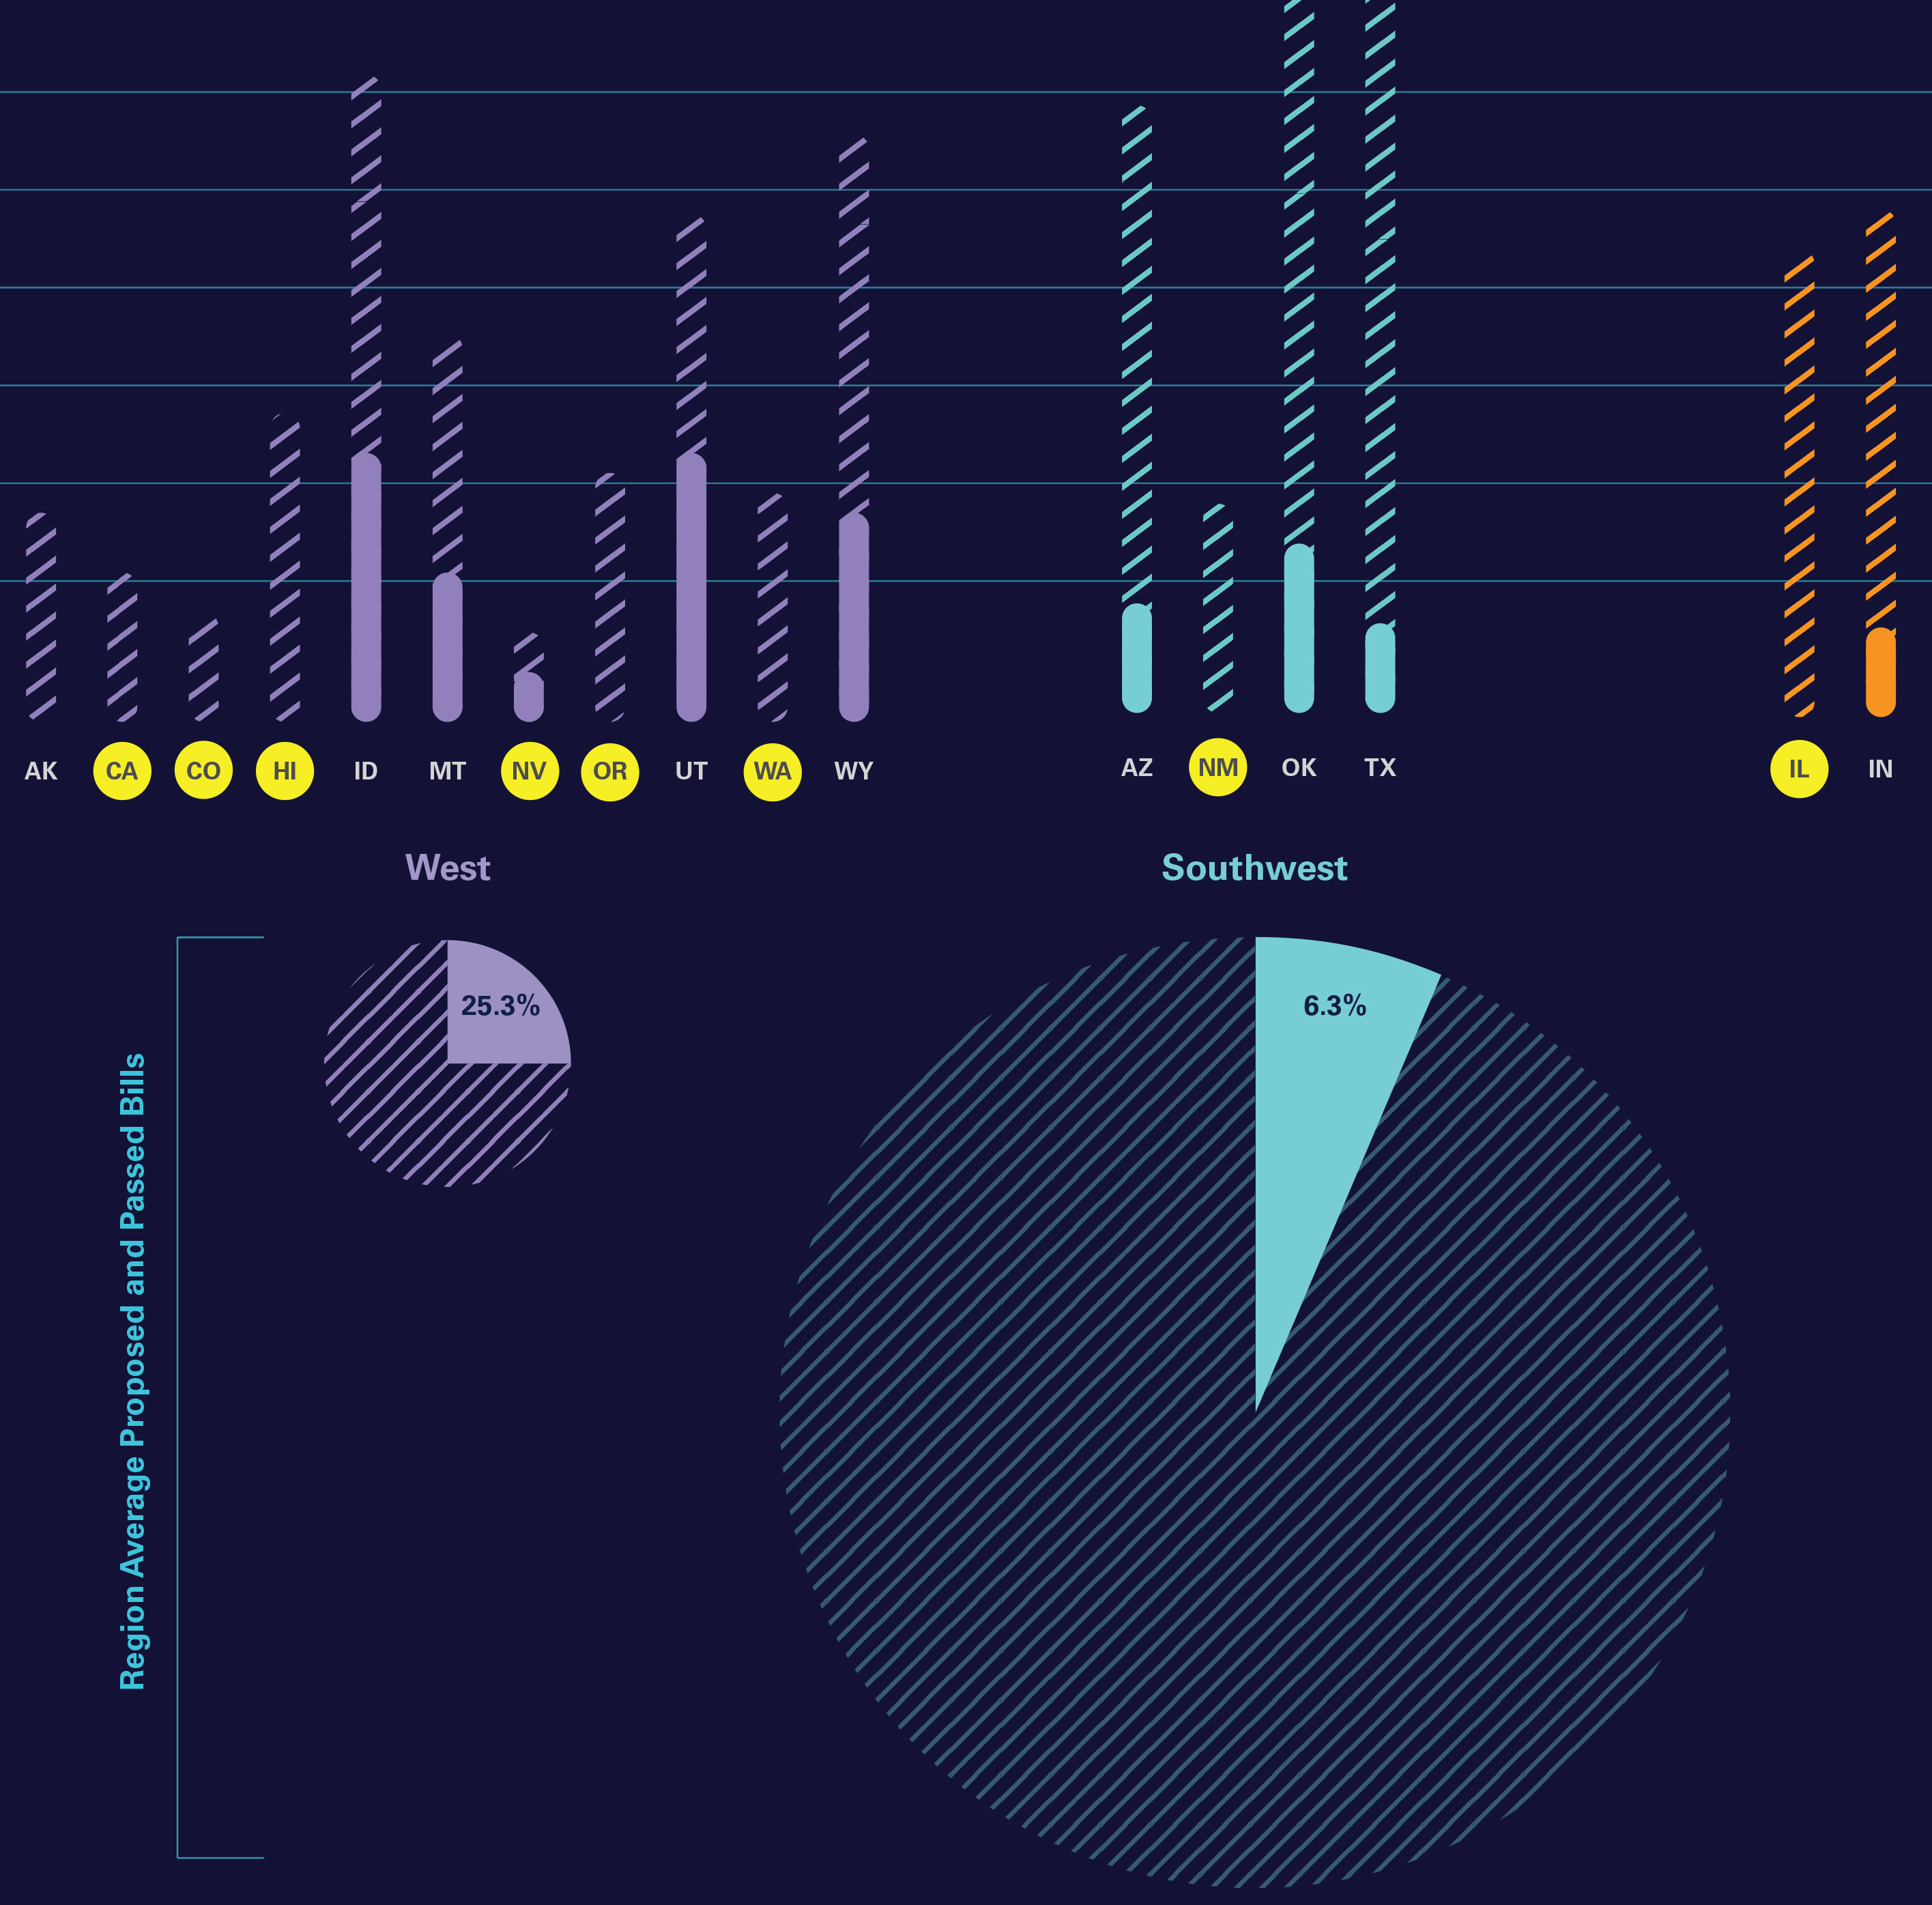
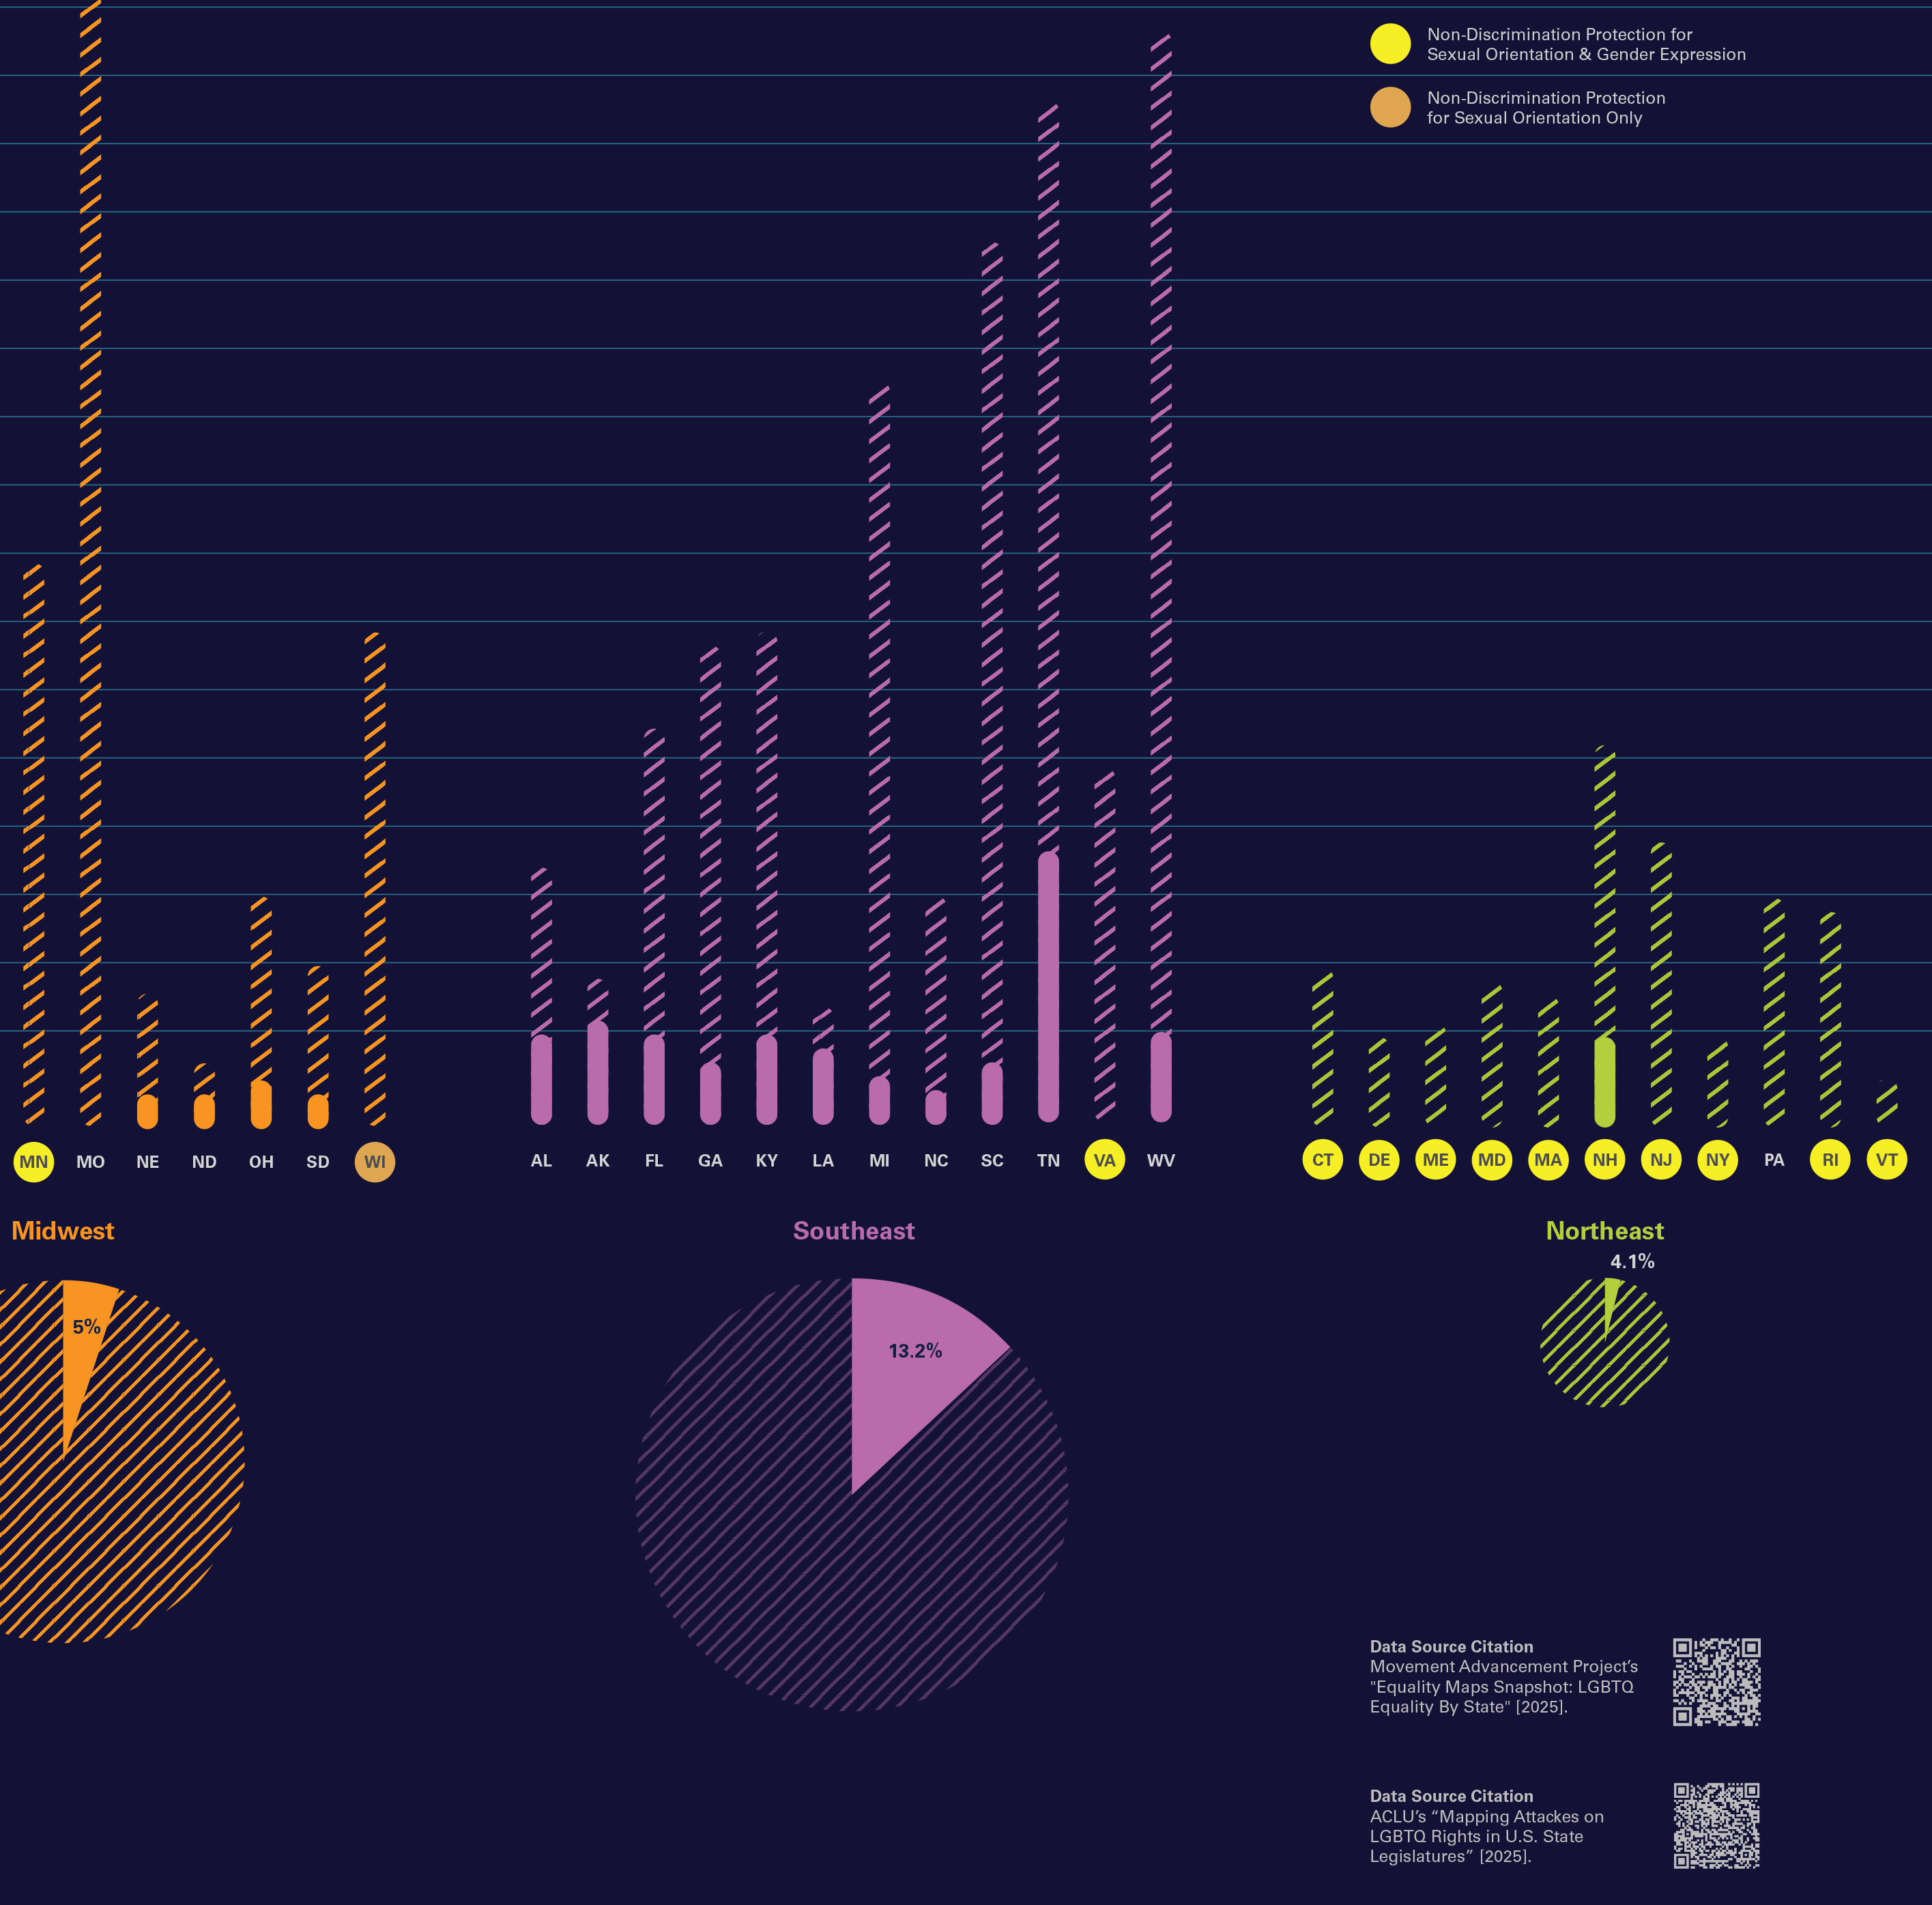
This informaiton design visualizes the gap between the volume of anti-LGBTQ+ legislation introduced in state legislatures and the smaller but still consequential number of bills that ultimately become law. Organized by state and U.S. region, the design reveals stark geographic patterns, with the Midwest, Southwest and Southeast showing especially high levels of legislative activity, while the Northeast consistently remains lower. Oklahoma, Missouri, Texas and West Virginia are states with the most proposed legistlation. While
Tennessee has the highest number of anti-LGBTQ+ passed legislation.
In addition, yellow circles indicate states with existing non-discrimination protections, revealing a clear correlation: states lacking comprehensive protections, particularly for gender identity and expression, tend to introduce and pass significantly more anti-LGBTQ+ bills. By pairing legislative volume with the presence or absence of civil rights safeguards, this graphic highlights how weak legal protections often coincide with heightened political targeting. The contrast between proposed and enacted laws underscores how legislative pressure alone—regardless of passage—contributes to an increasingly hostile climate for LGBTQ+ communities.
Data sources:
The Movement Advancement Project -
Snapshot: LGBTQ Equality by State American Civil Liberties Union -
Mapping Attacks on LGBTQ Rights in U.S. State Legislatures in 2025