LGBTQ+ Equality Project
Positive (+) vs. Negative (-) Proposed Legislation
Positive (+) vs. Negative (-) Proposed Legislation
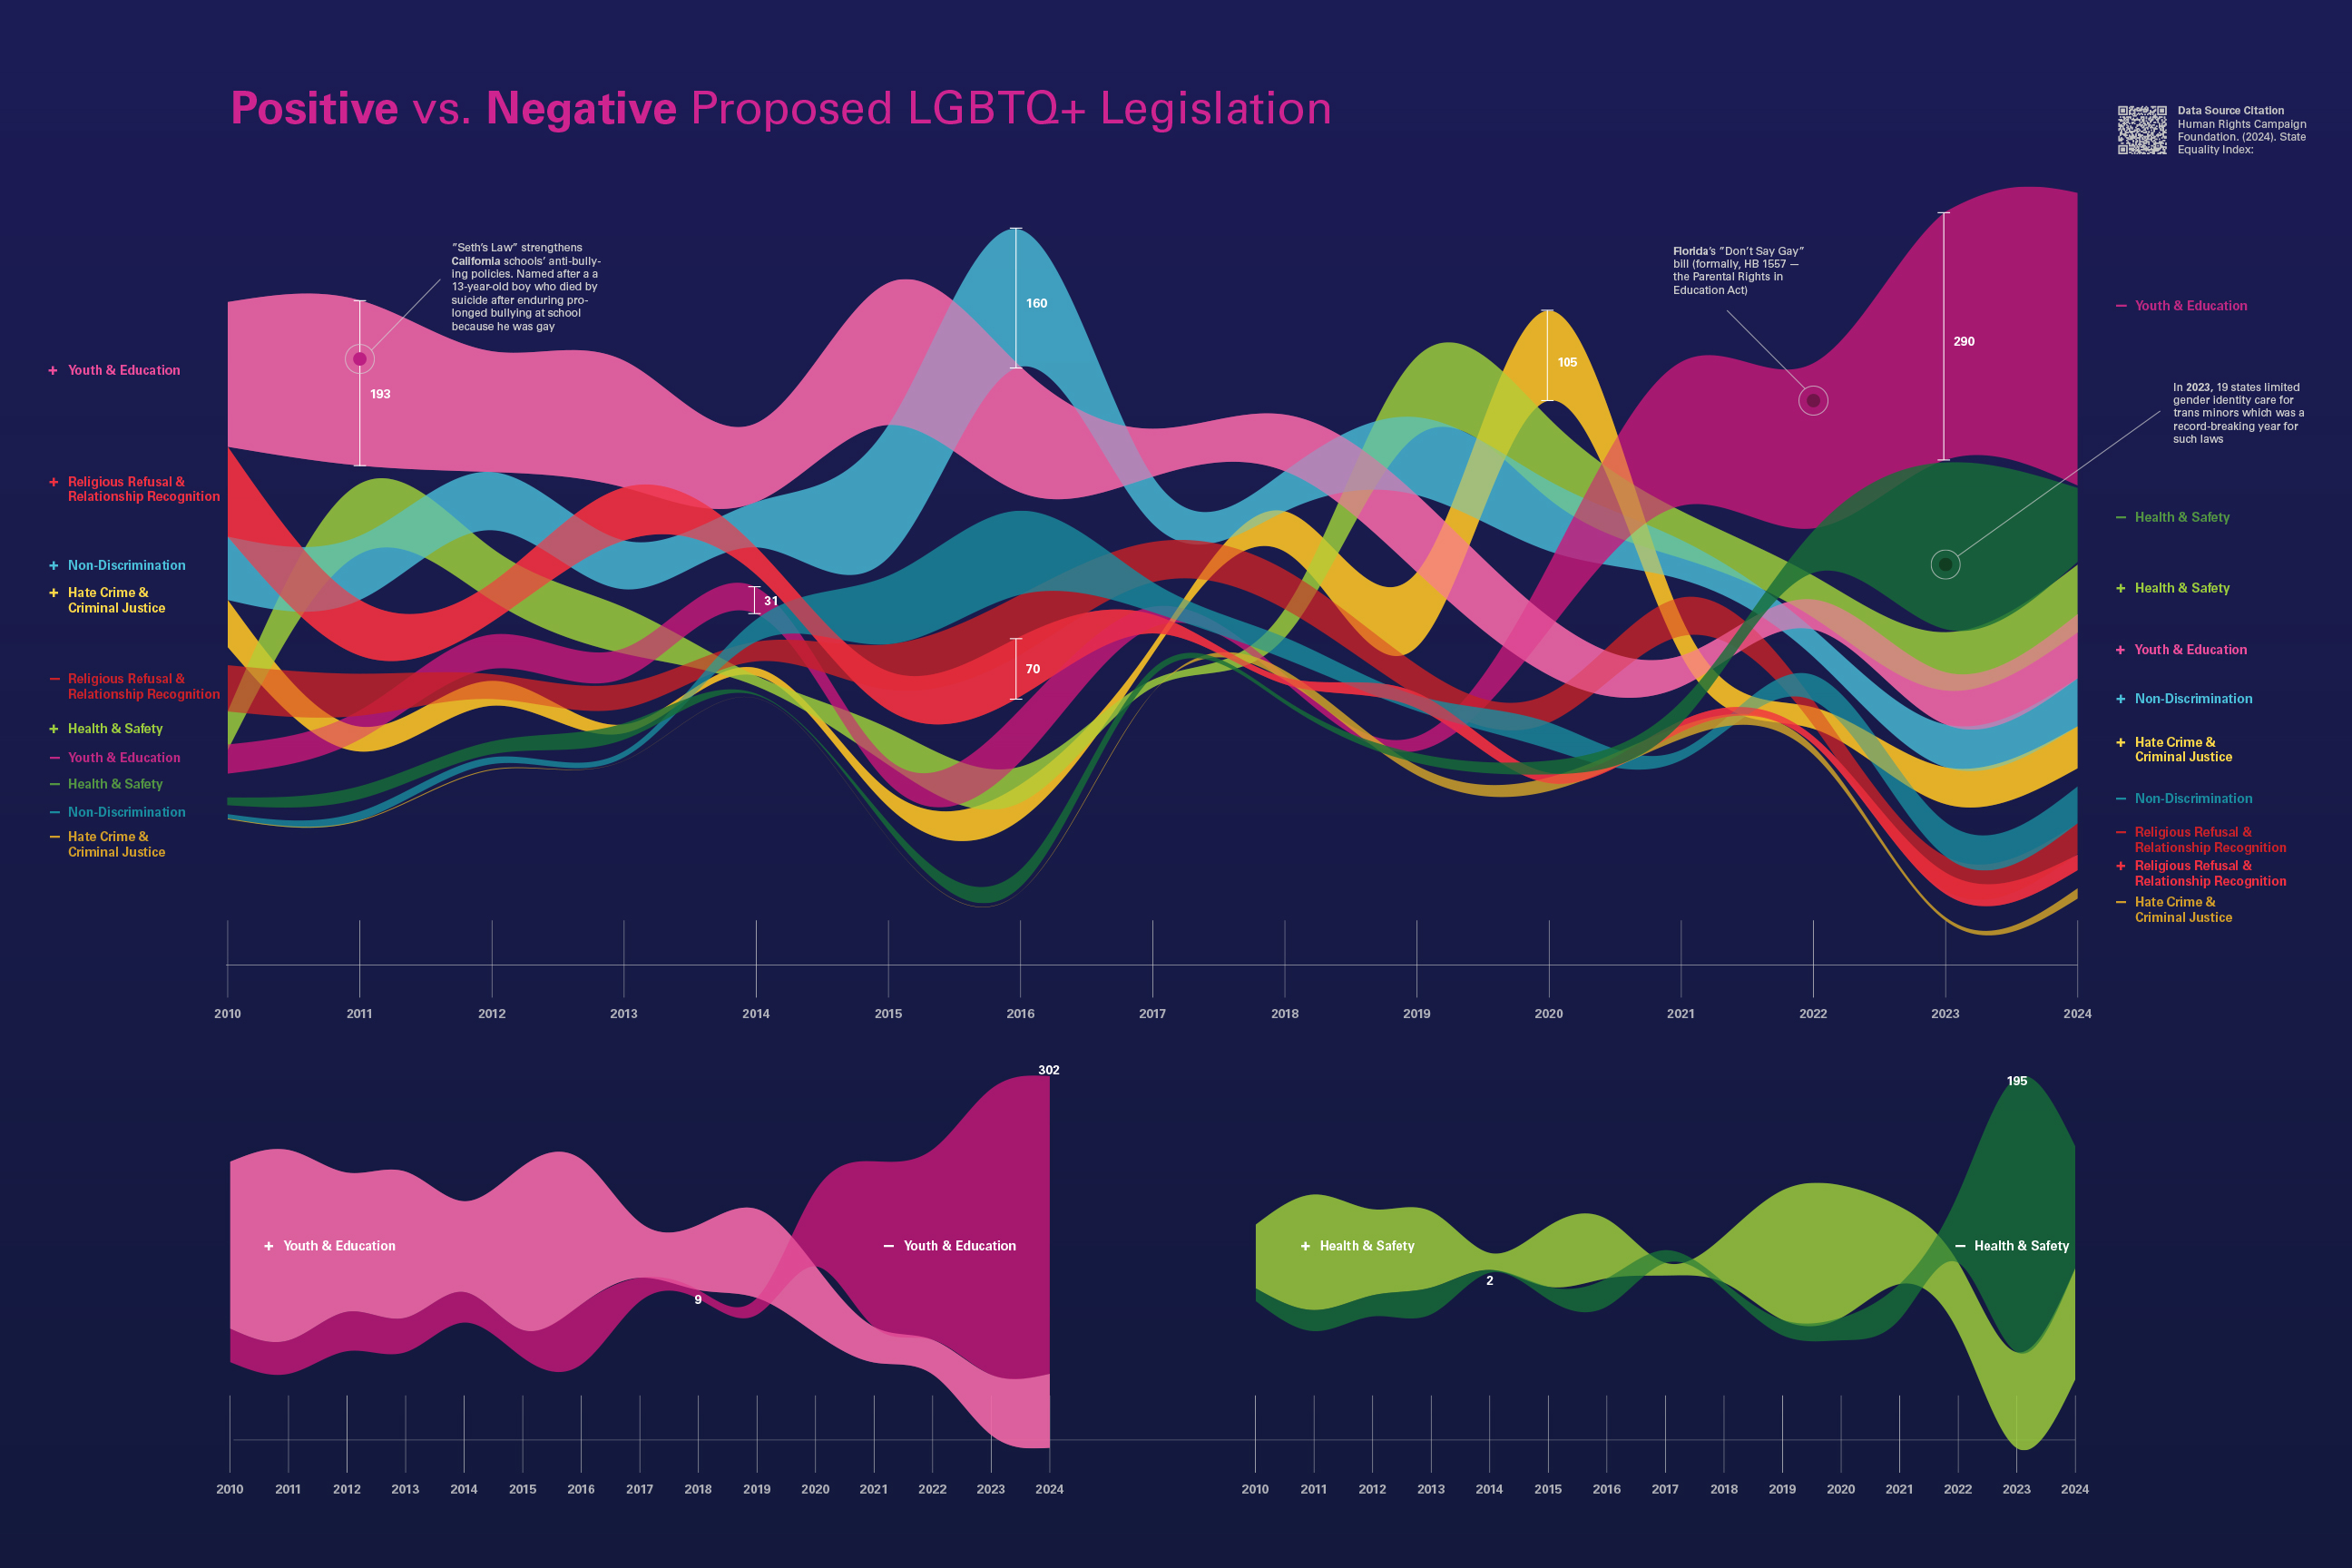
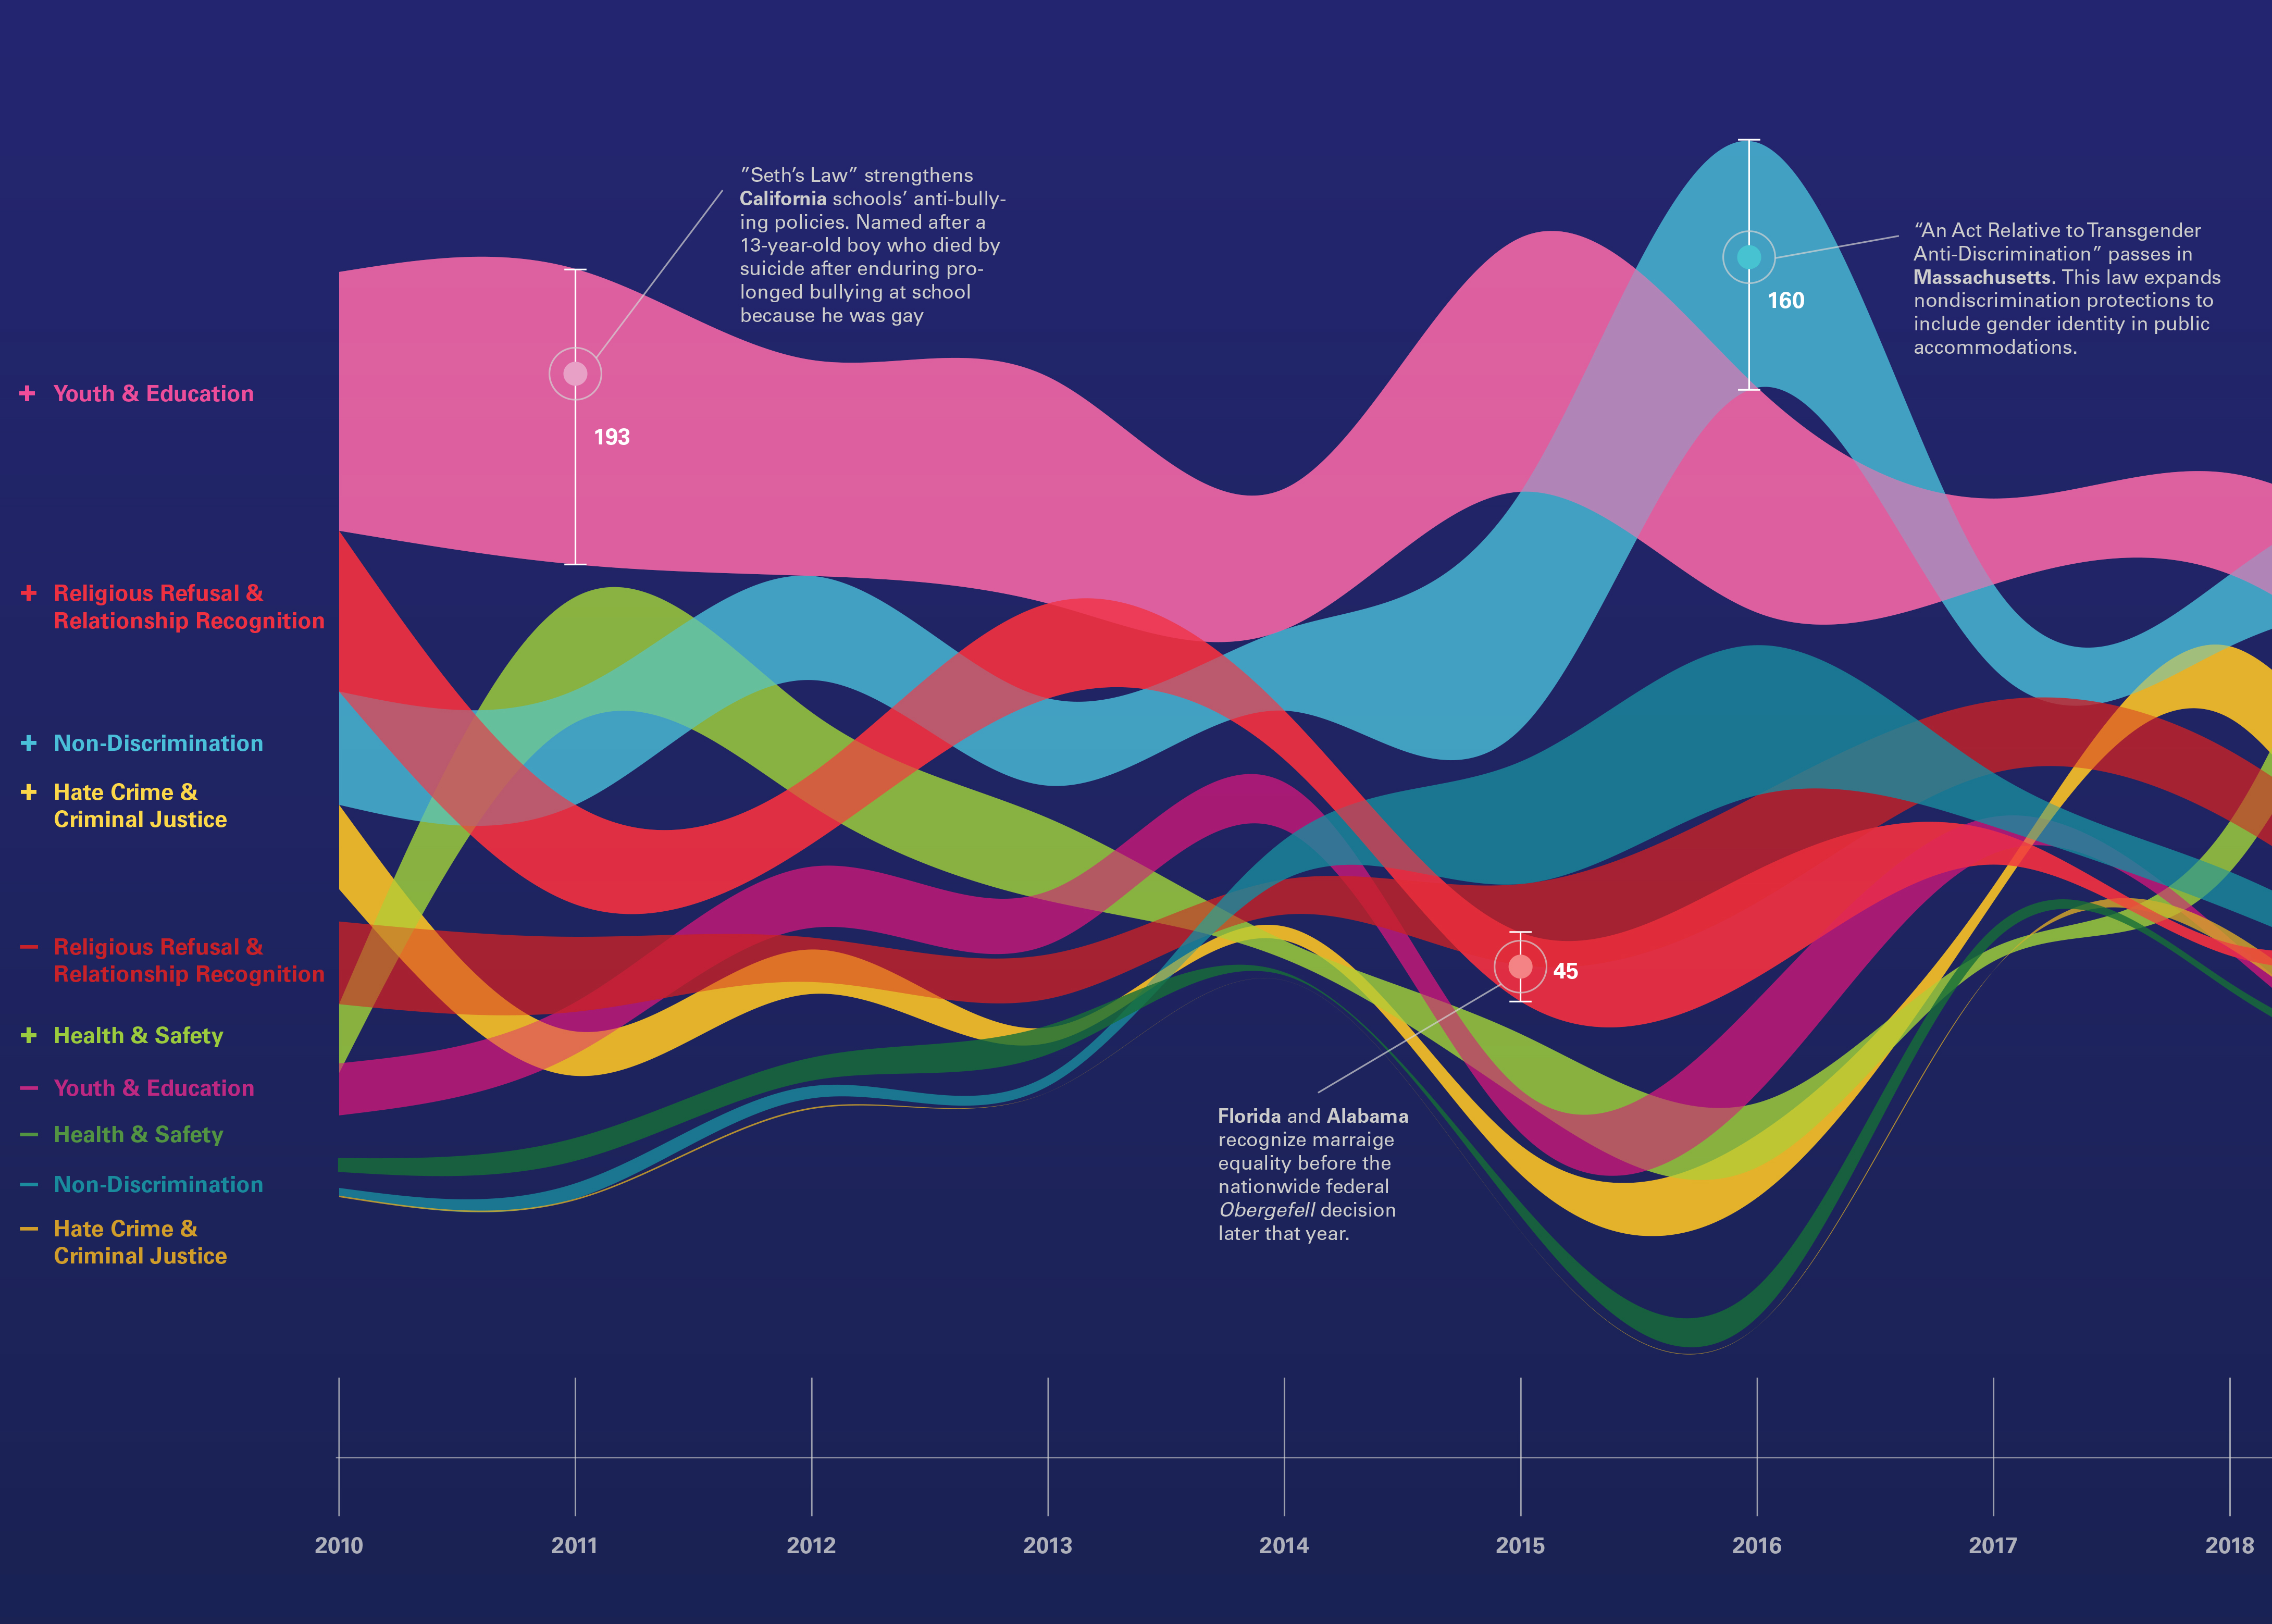
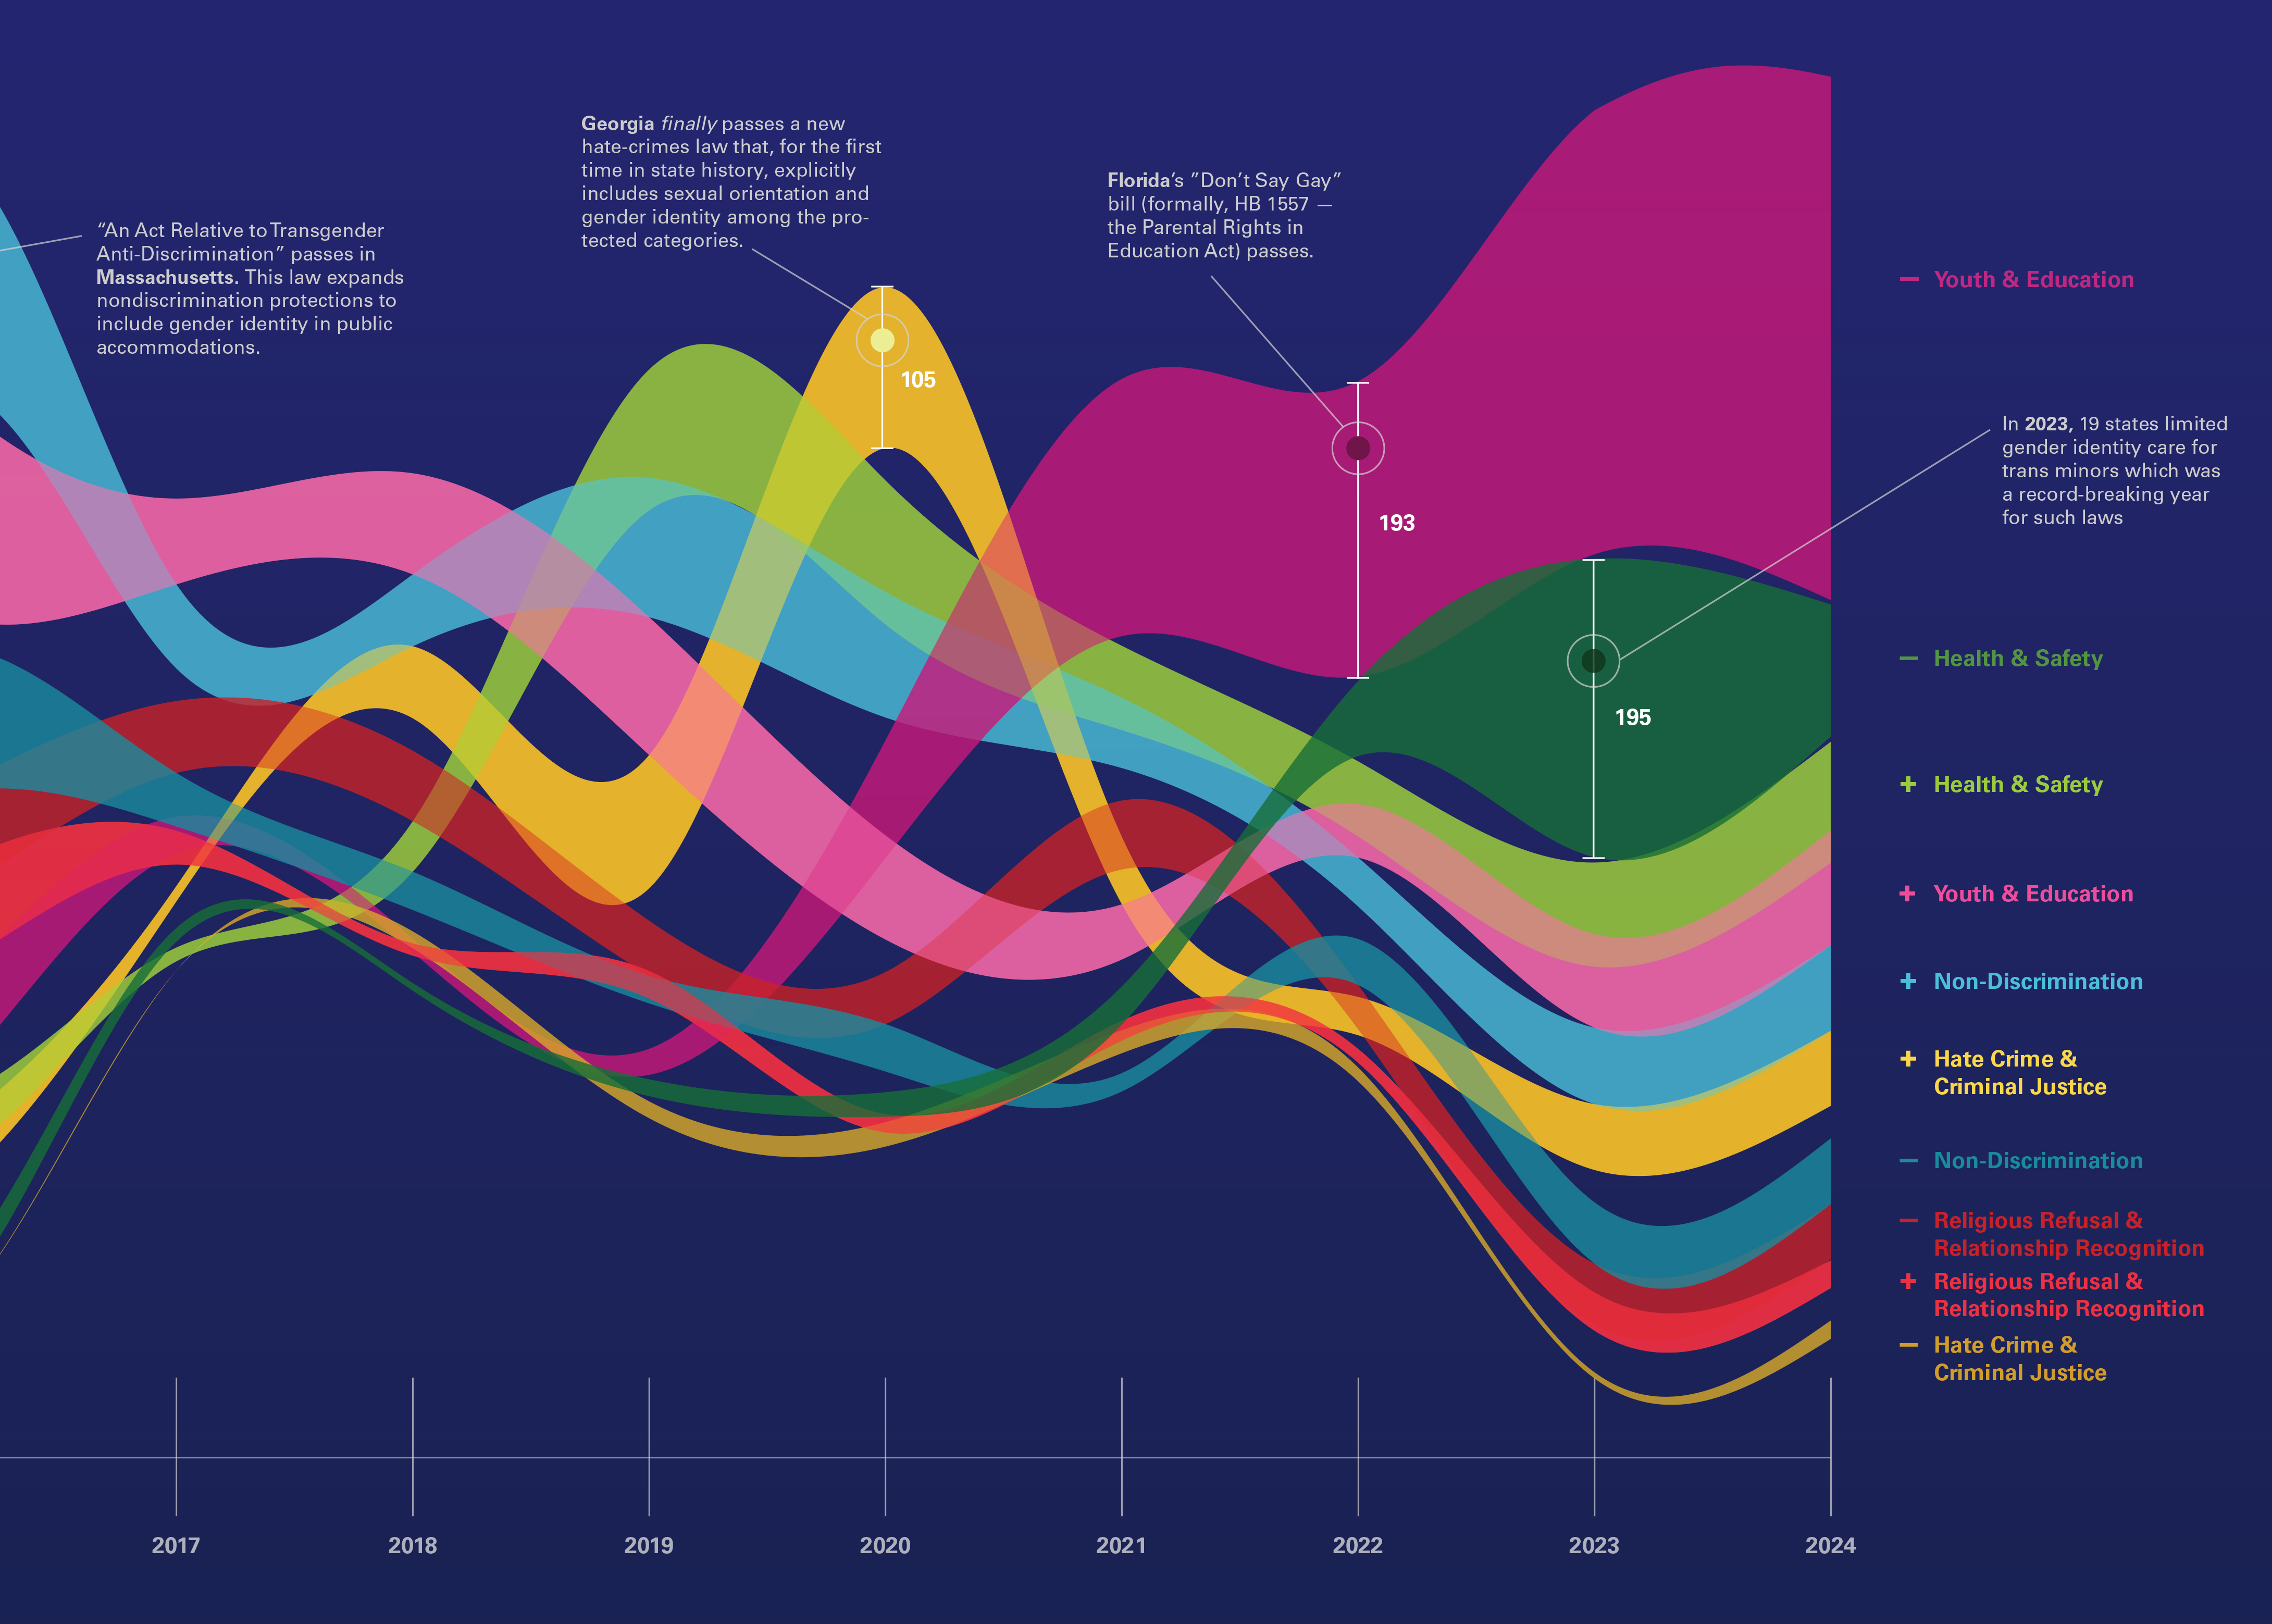
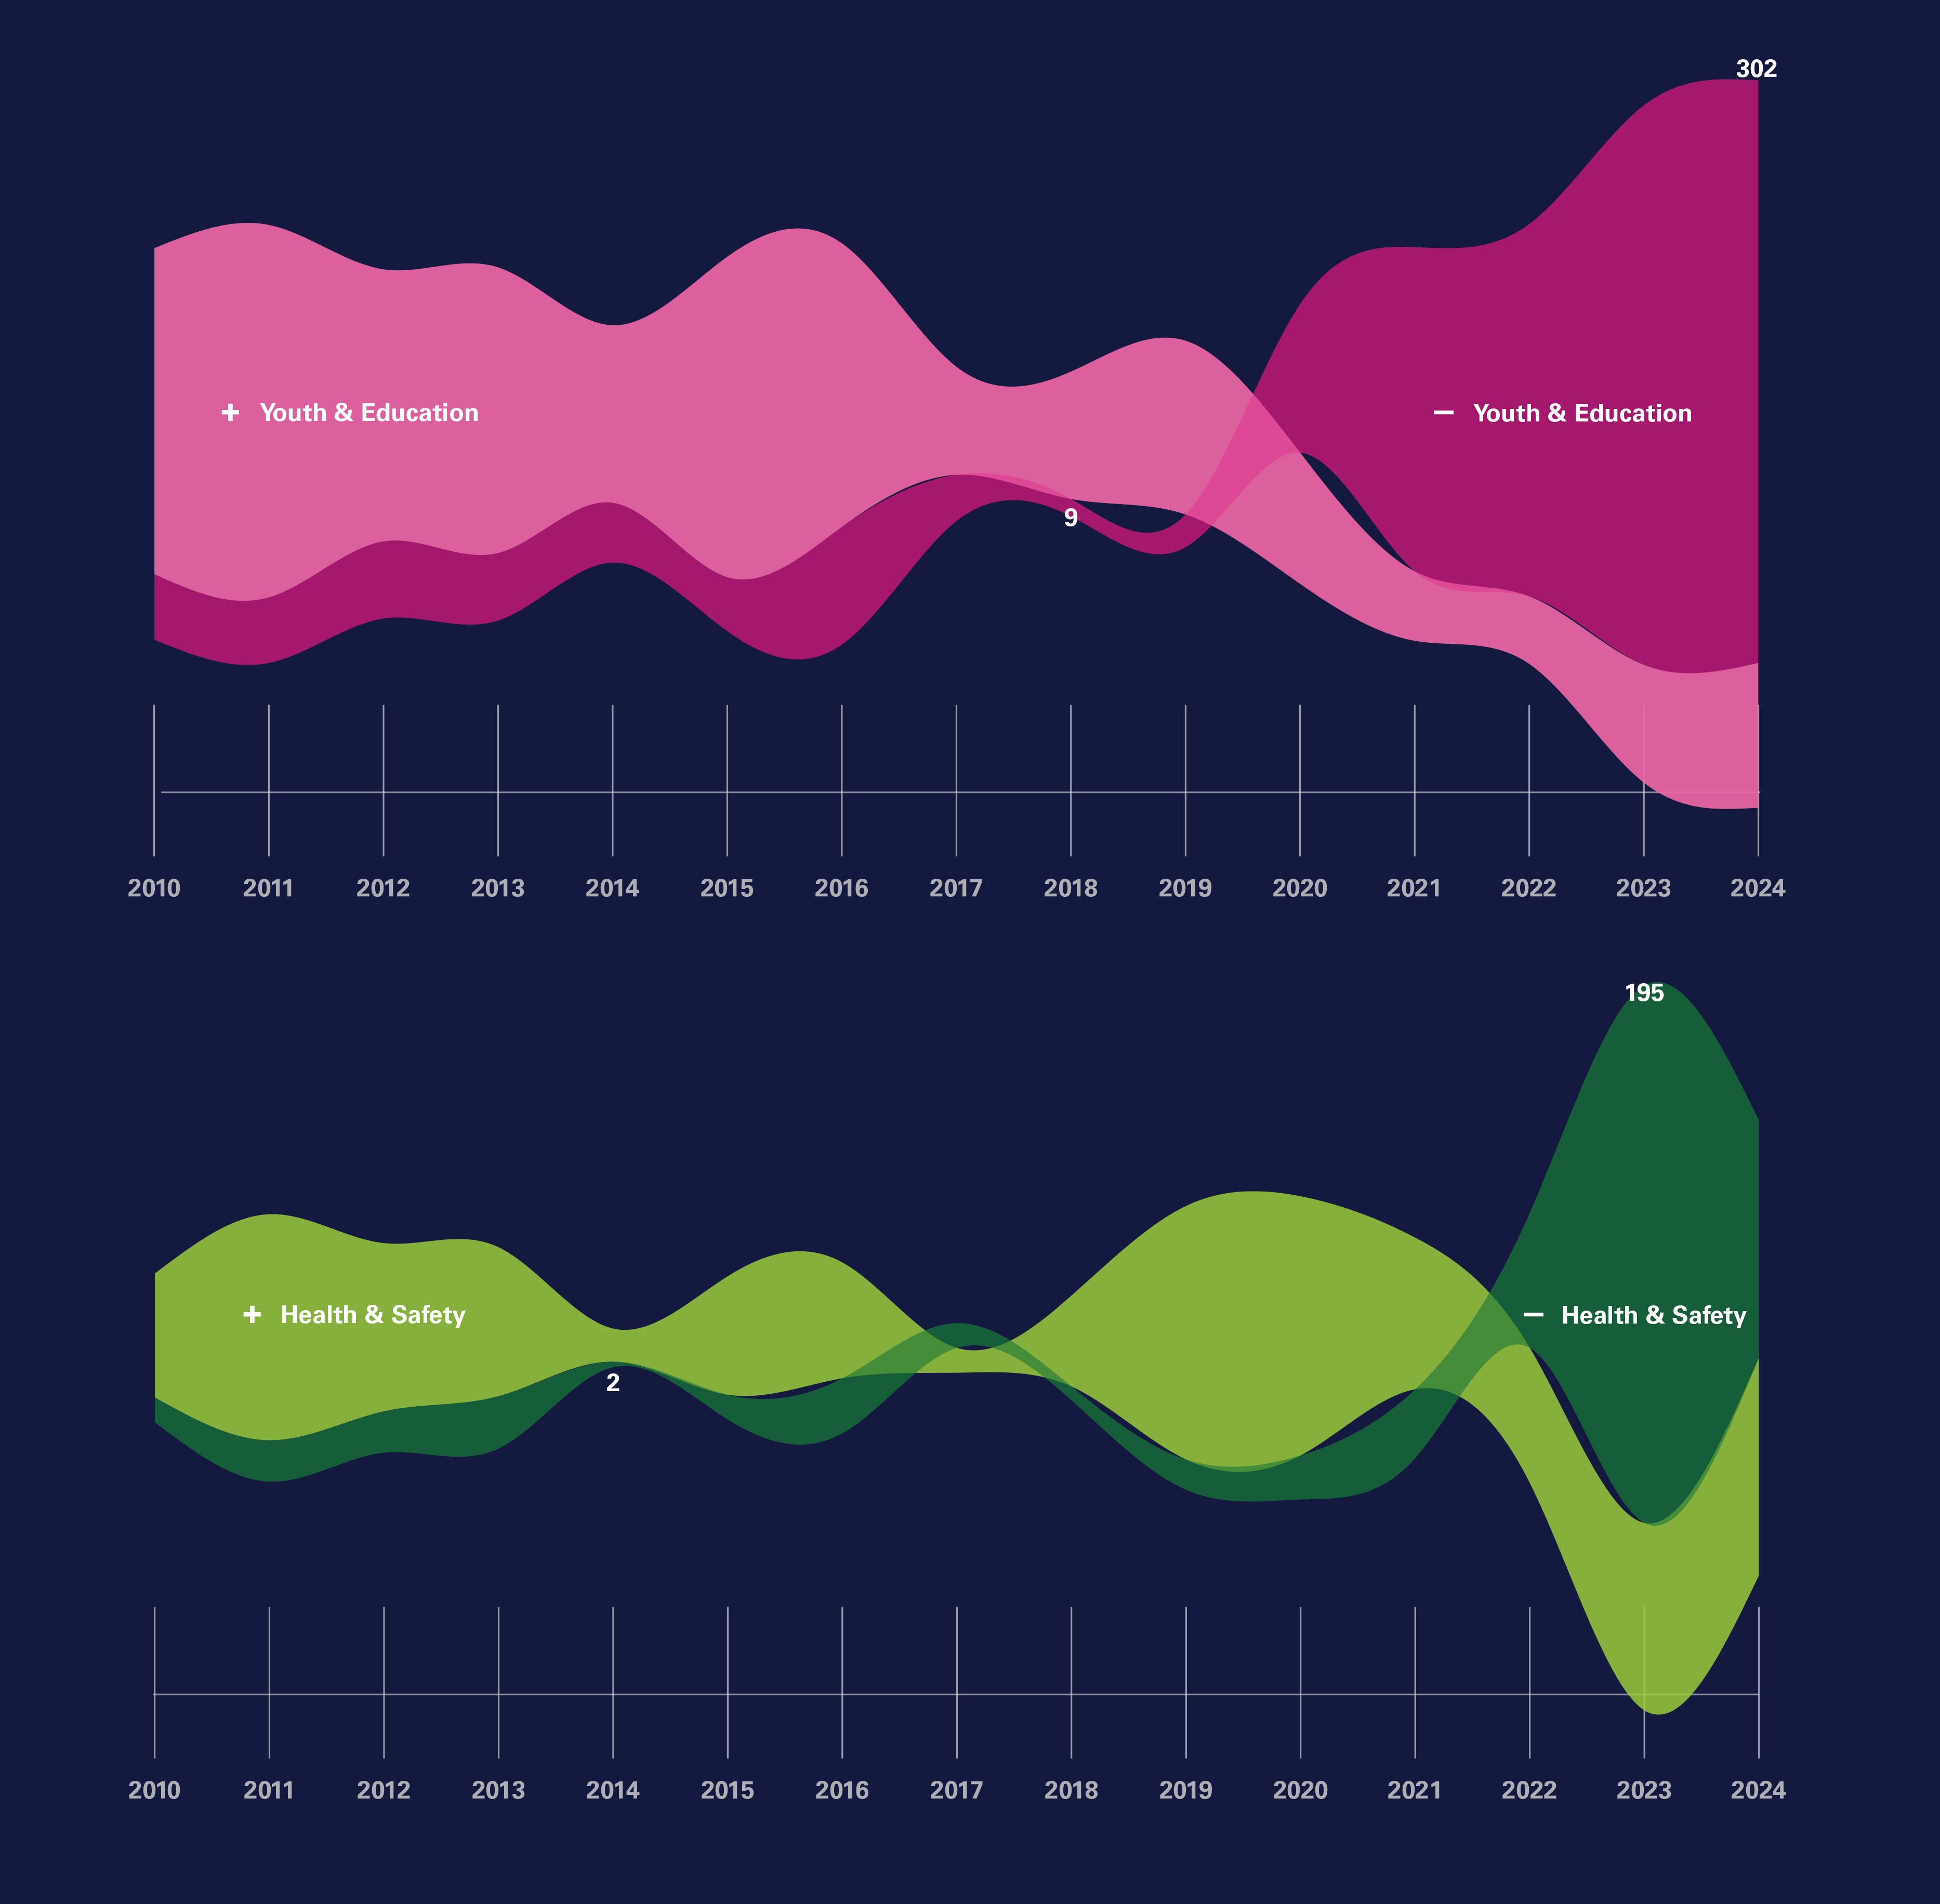
This information design communicates the shifting landscape of proposed LGBTQ+ legislation over the past fourteen years, illustrating how the balance between positive and negative bills has transformed across key policy areas. The streamgraph format reveals not only the volume of activity each year, but also the momentum and volatility of different categories from youth and education to health, safety, non-discrimination, and criminal justice. Early years show a more balanced mix of supportive and harmful proposals, yet toward the present the negative waves sharply intensify, particularly in legislation targeting LGBTQ+ youth and health & safety. Peaks, dips, and surges across the timeline make it easy to see political turning points and record-setting years, emphasizing how legislative focus has shifted from protections to restrictions. Overall, the design highlights an escalating trend of anti-LGBTQ+ policymaking while underscoring the disproportionate impact on young people communicating a visual narrative of both progress and backlash.
Data for these inforgrapics is from the HRC's 2024 State Equality Index.
About the Process: First, data was researched, collected and formatted in an Excel spreadsheet. Next, Flourish was used to intially visualize the streamgraphs. Further work on the infographic and overall design was completed in Adobe Illustrator.
Streamgraphs are an effective choice here because they show change over time in a fluid, immediately comparative way. The layered, flowing shapes make it easy to see how categories of LGBTQ+ legislation, such as Youth & Education and Health & Safety expand, contract, and shift from mainly positive proposals to increasingly negative ones. Their undulating forms highlight both volume and momentum, making surges and declines instantly recognizable and long-term turning points more visible than in traditional bar or line charts. By stacking categories across the timeline, the streamgraph makes the cumulative pressure of these legislative shifts clear, revealing not just how much legislation has been proposed, but how its overall balance and focus have transformed over time. The form matches the message: waves of legislation swelling and crashing. You can feel the shift toward negative bills in a way no other chart type communicates.
Size: 36"x24" printed
© 2026 danielle currier